Complete and informative charting
To make the right choice it is equally important to see the small details and the big picture. In MultiCharts, you can easily perform multi time frame analysis without cumbersome extras, such as custom DLLs and global variables.
MultiCharts
Several data series in different resolutions
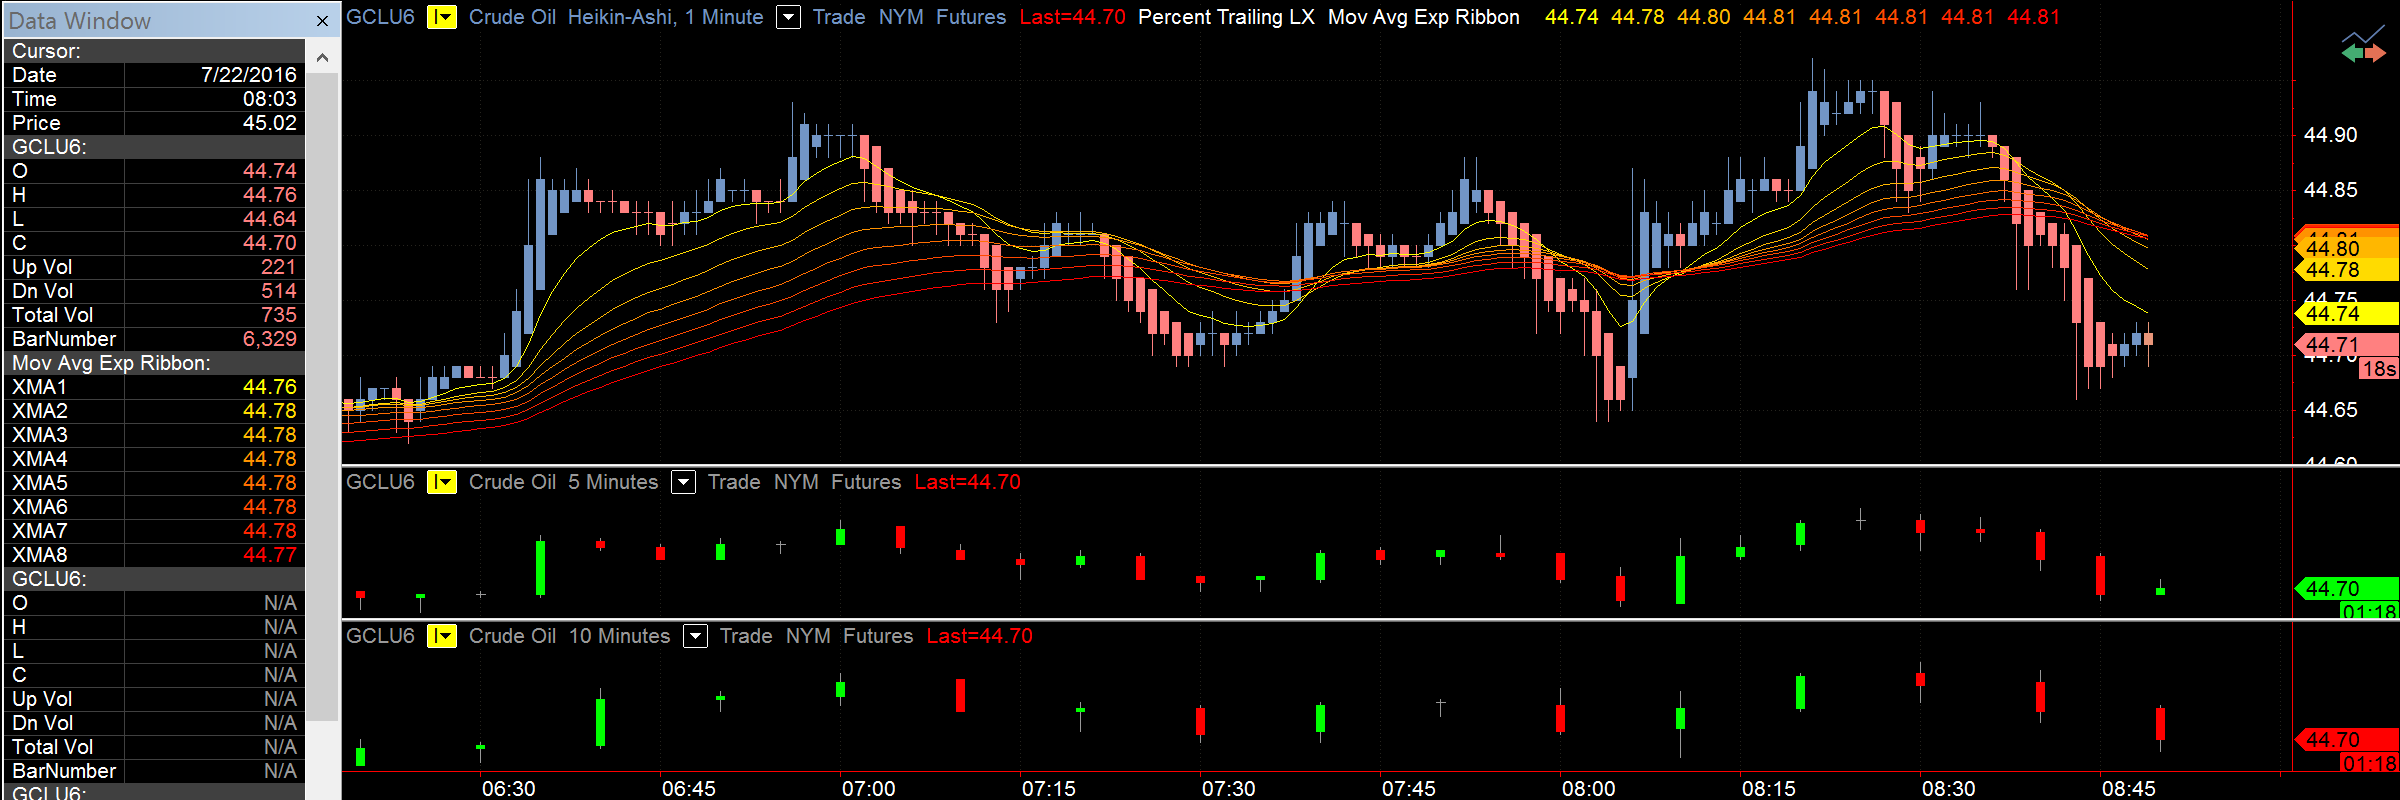
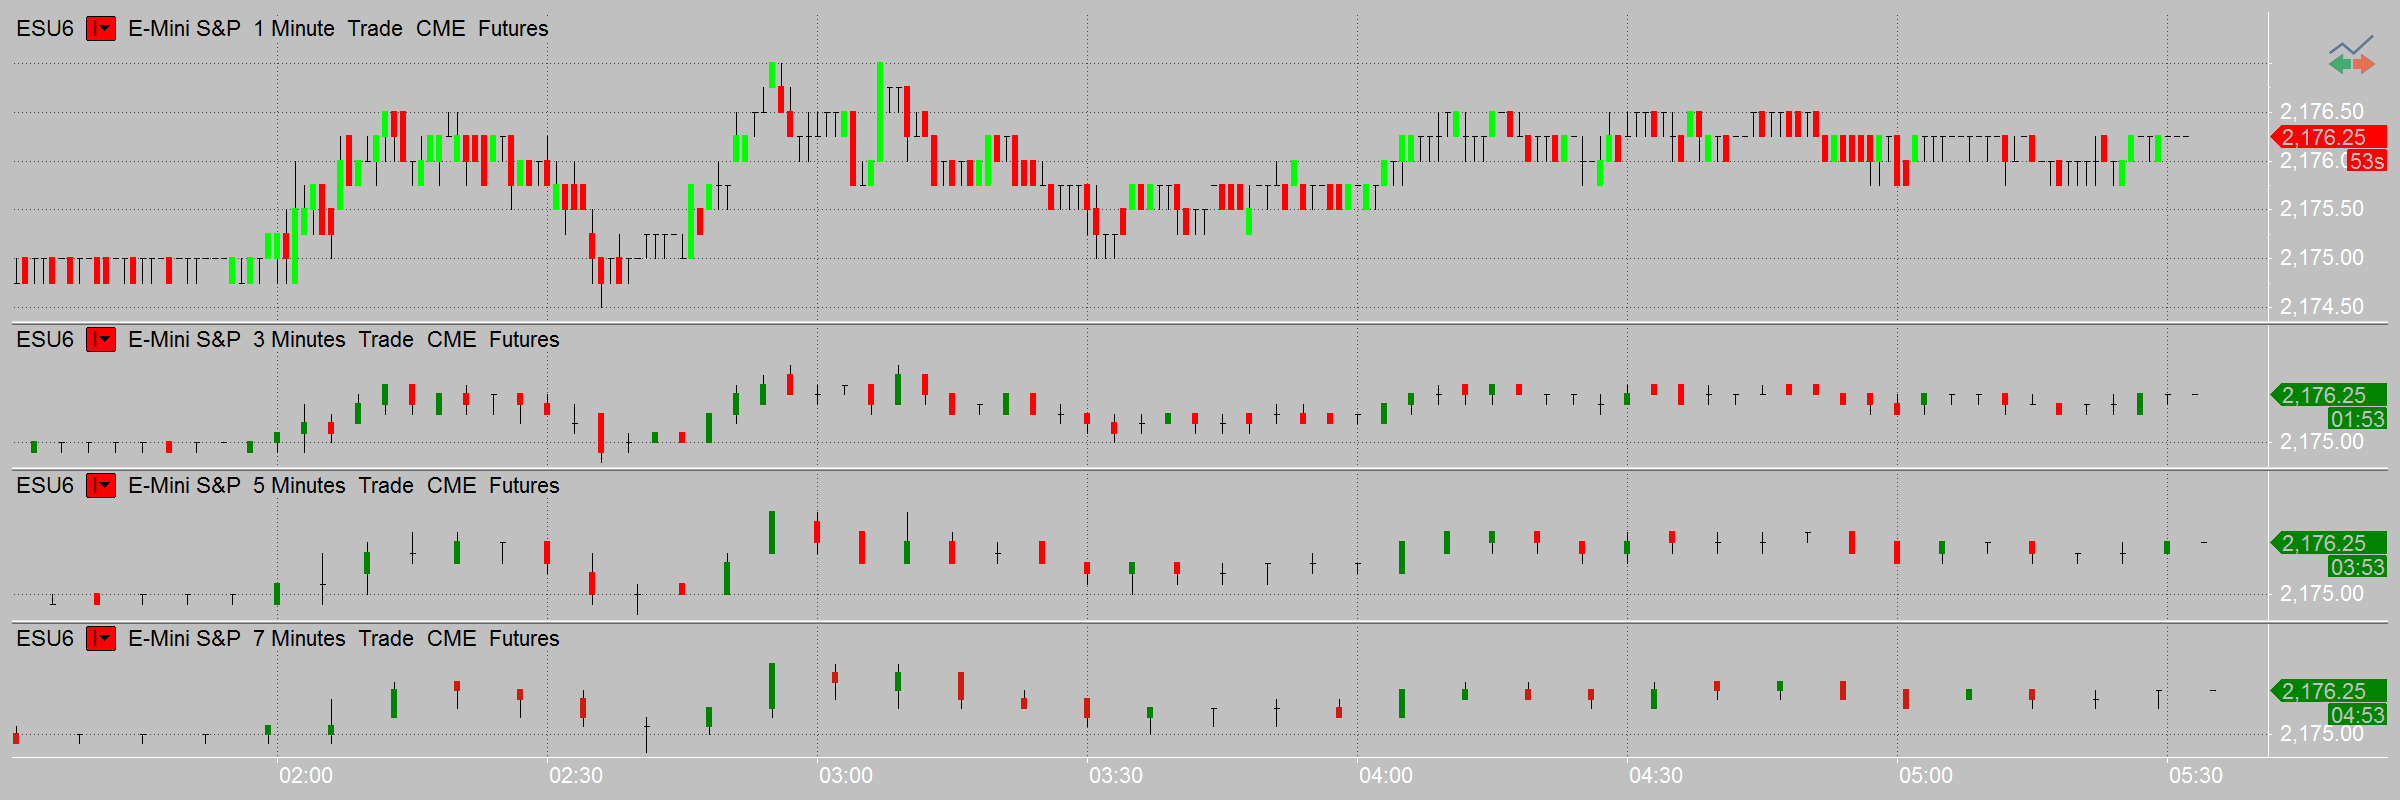
Working with several data series is one of the main features in MultiCharts. There is no need for cumbersome workarounds—you can simply add several price series into one chart window. The trading platform allows you to mix any resolutions, and it automatically aligns them on the time scale. For example, you can view hourly resolutions with daily resolutions, one-second symbols with 10-tick symbols, or range bars with volume bars.
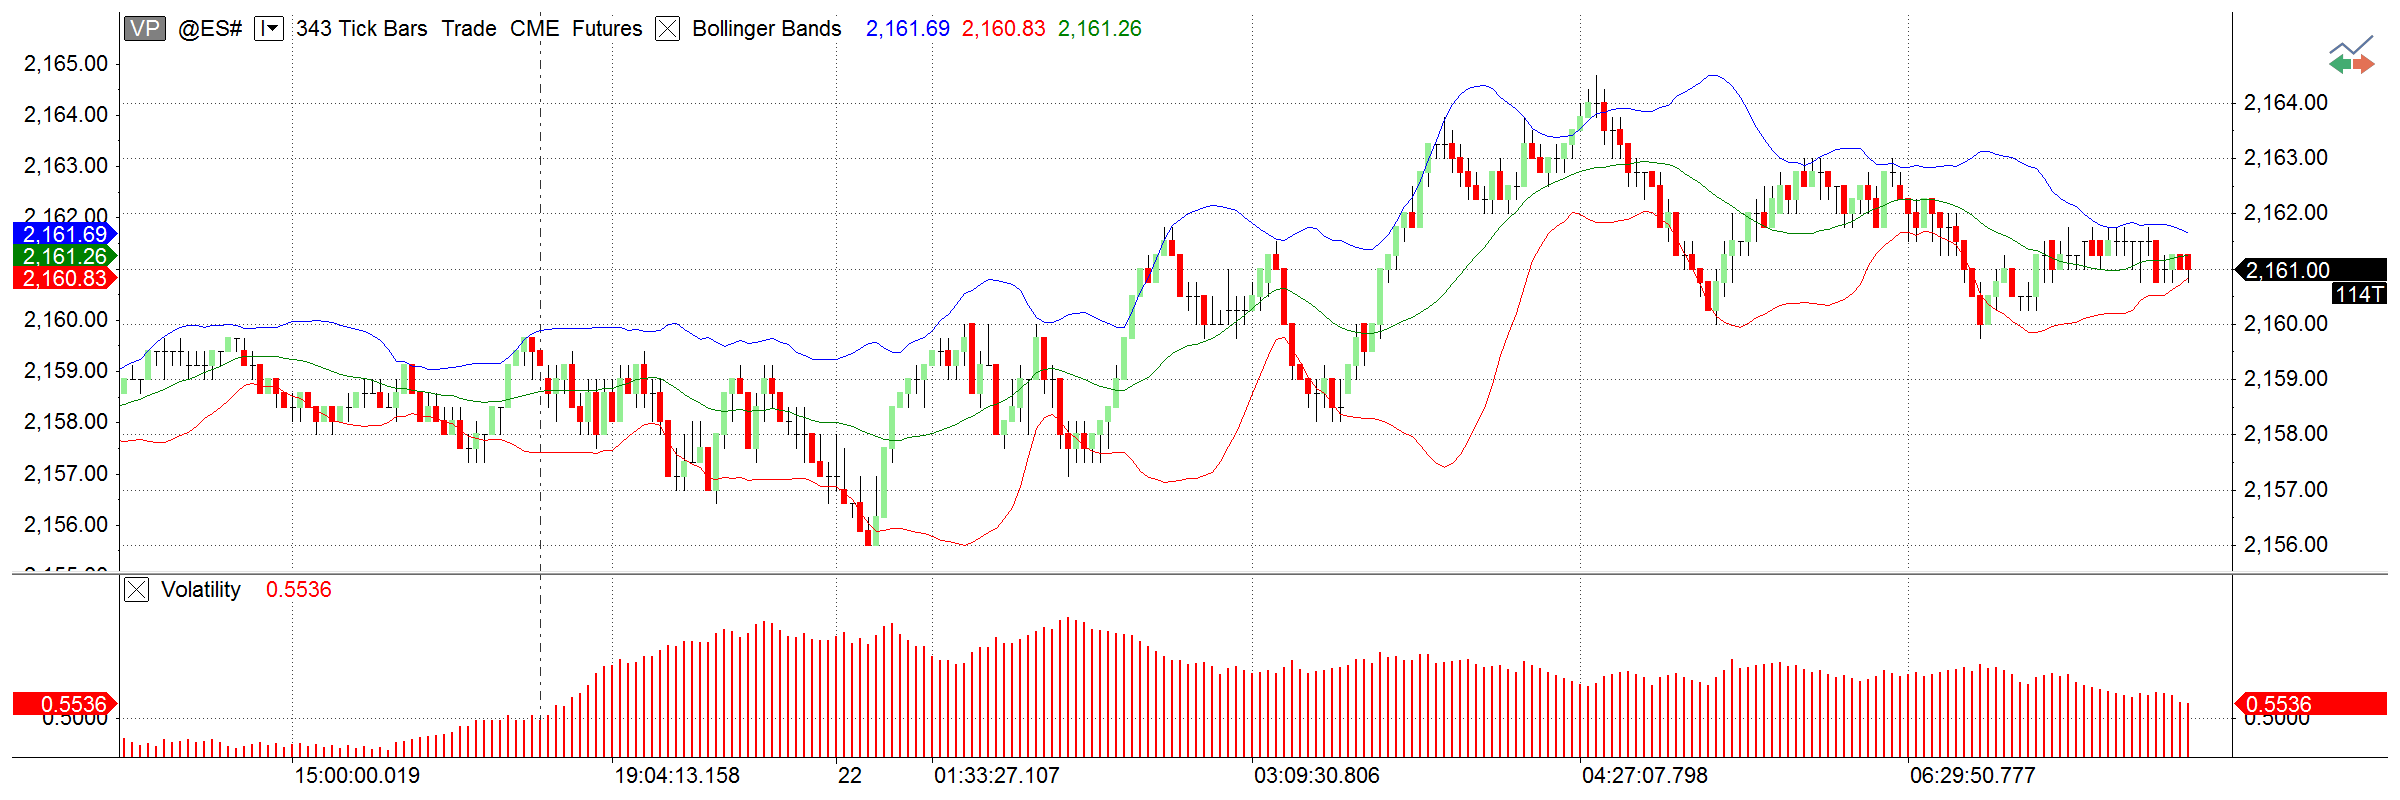
Behind-the-scenes calculations for multiple data series
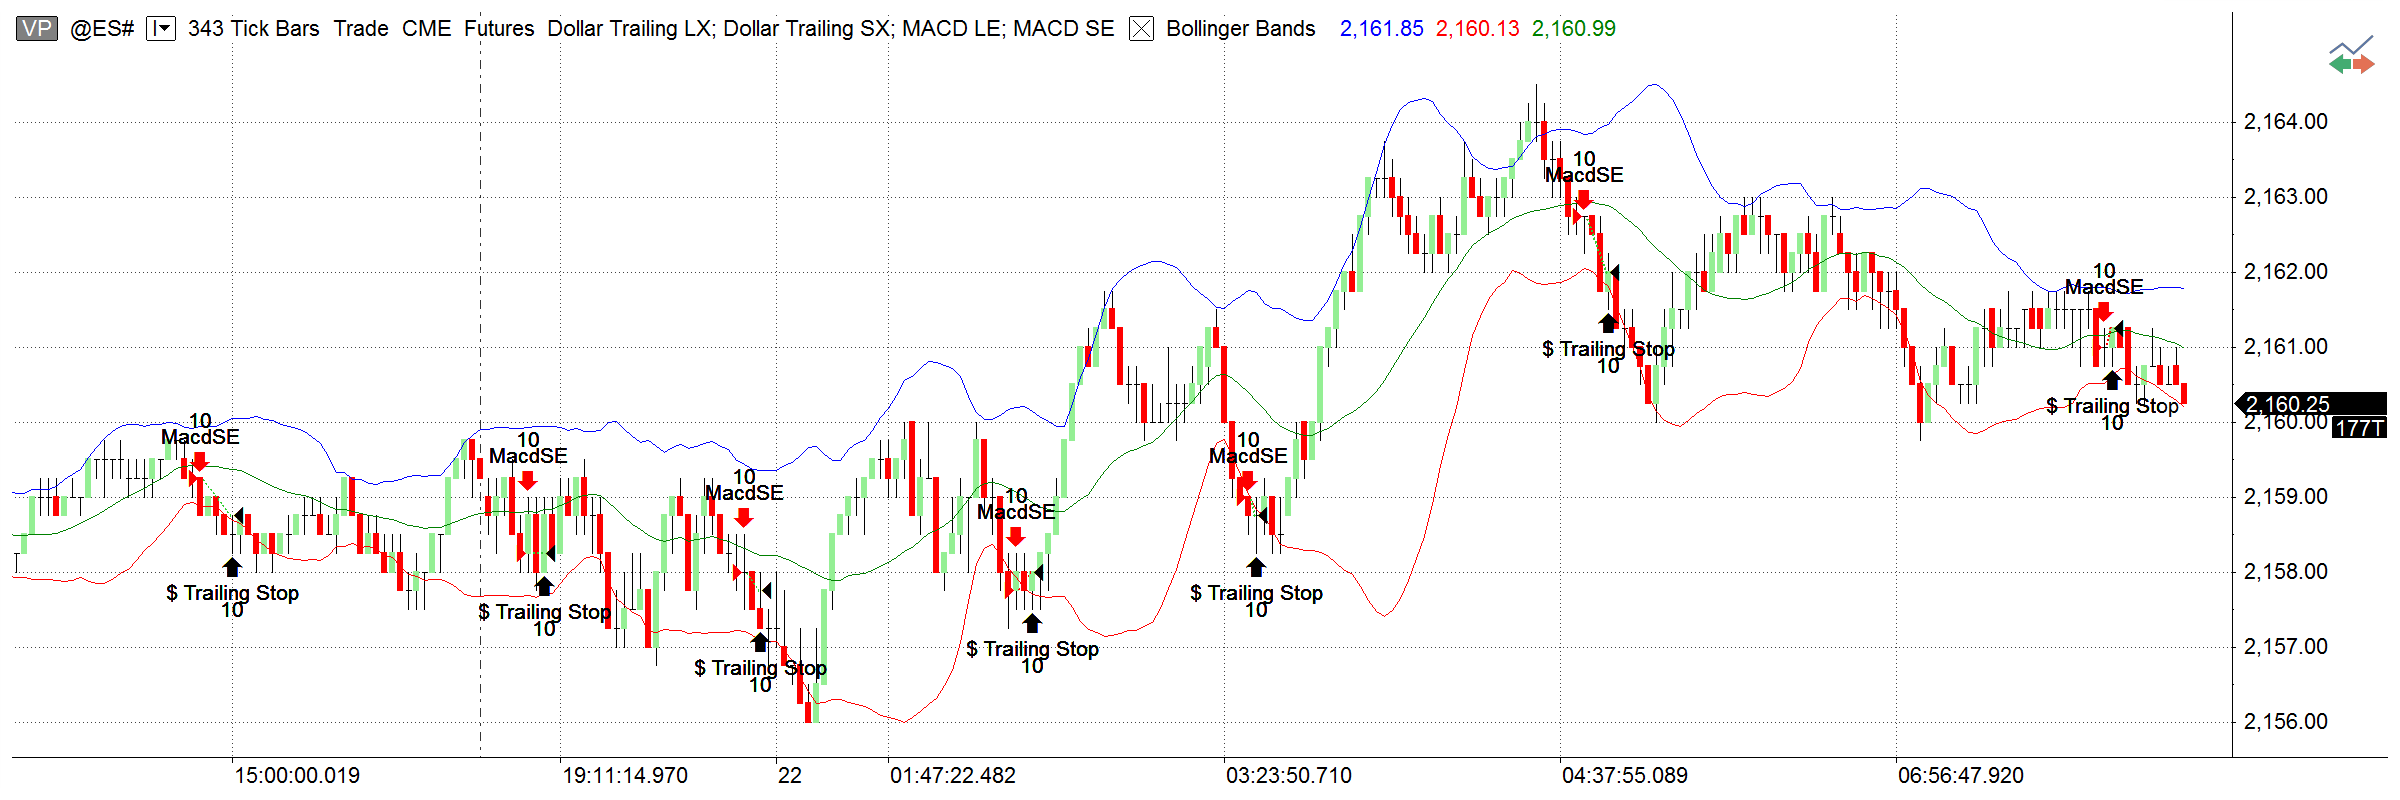
This feature allows you to create indicators or strategies that use several data series for its calculations. For example, you could use Bollinger Bands on a one-minute chart, but it will be calculated based on daily data. You only need a few clicks to accomplish this. The program does all of the calculations behind the scenes. It even chooses the correct visualization, such as overlaying data series.
Combine historical and real-time data from different feeds
On top of that, you can combine historical data from one provider and use real-time data from another, in one or more subcharts. This provides the flexibility and choices necessary to meet the needs of your individual trading style. For example, imagine that your datafeed does not provide ask and bid history, but does provide quality minute data. In this case, you can combine minute data from your datafeed with data from other vendors to get the complete picture.
Customization and flexibility that meets your needs
You can customize the look of MultiCharts from the overall appearance to the tiny details. You have full control to focus on the important data without overcrowding it with excess information.
Adjustable
The colors can be adjusted to quickly pick out important information. Bar spacing can be adjusted for easier viewing. Change the zoom and the margins for optimal chart setup. Session breaks, empty periods, indicators, price series, title bars, scroll bars, and divider lines are all easily customized to improve the way you view information.
Dynamic
Changing the visual order of data series, colors, spacing, font labels, divider line styles and more is another great way to pinpoint important information. Chart compression locates the needed data—even among millions of bars. Various dynamic grid styles are supported for added flexibility: point, solid, horizontal, dotted, or detailed dotted grids.
More resolutions mean more possibilities
Standard chart resolutions include both time-based and count-based options. Time-based choices include anything from seconds to years. Count-based resolutions are presented by ticks, number of trades, number of contracts traded, price range, and number of changes options.
MultiCharts
Millions of bars on one chart
In addition, the 32-bit trading platform can easily display 7.5 million bars on one chart for visual analysis and backtesting, which is usually available only in high-end, institutional products. The 64-bit version takes it even further and can display any number of bars, limited only by the amount of memory on your computer.
No volume loss
Volume bars in MultiCharts are calculated based on the capped principle. This means that the remainder of the volume is transferred to the next bar. For example, if a tick arrives with the volume of 100 and your chart resolution has a volume bar of 75, then 25 will be transferred to the next bar. With this method, no volume is lost.
Hourly bars vs. 60-minute bars
Hourly bars are different from 60-minute bars. Hourly bars use an astronomical clock, but 60-minute bars are bundled together. With the one-hour resolution, the hourly bar would be from 8:30 to 9:00—not from 8:30 to 9:30, as it would look on a 60-minute bar.
Price scales and axes made for precision
Our trading platform allows you to set the price scales to match the type of analysis. You may choose between linear or semi-log axes for drastic price movements; two separate vertical scales, one for indicators and one for price movements; or even no vertical axes at all.
MultiCharts
Different views, different angles
Each scale can display the data from various angles. For example, a scale can show minimum to maximum values for the entire data range or only for a certain part of the series. Other useful touches include the ability to center the graph on the middle of the scale, set number of digits after decimals, and define the amount of labels present.
Overlay several price series
An important feature of trading software is the ability to overlay several price series with independent price scales. For example, it is possible to chart a financial instrument that costs several hundred dollars over another instrument that trades under a dollar. Then you can visualize the dynamics of price movement.
Precision where it counts
For added convenience, the Precise Price marker shows the exact last price and the Countdown feature shows how much time is left until bar close.
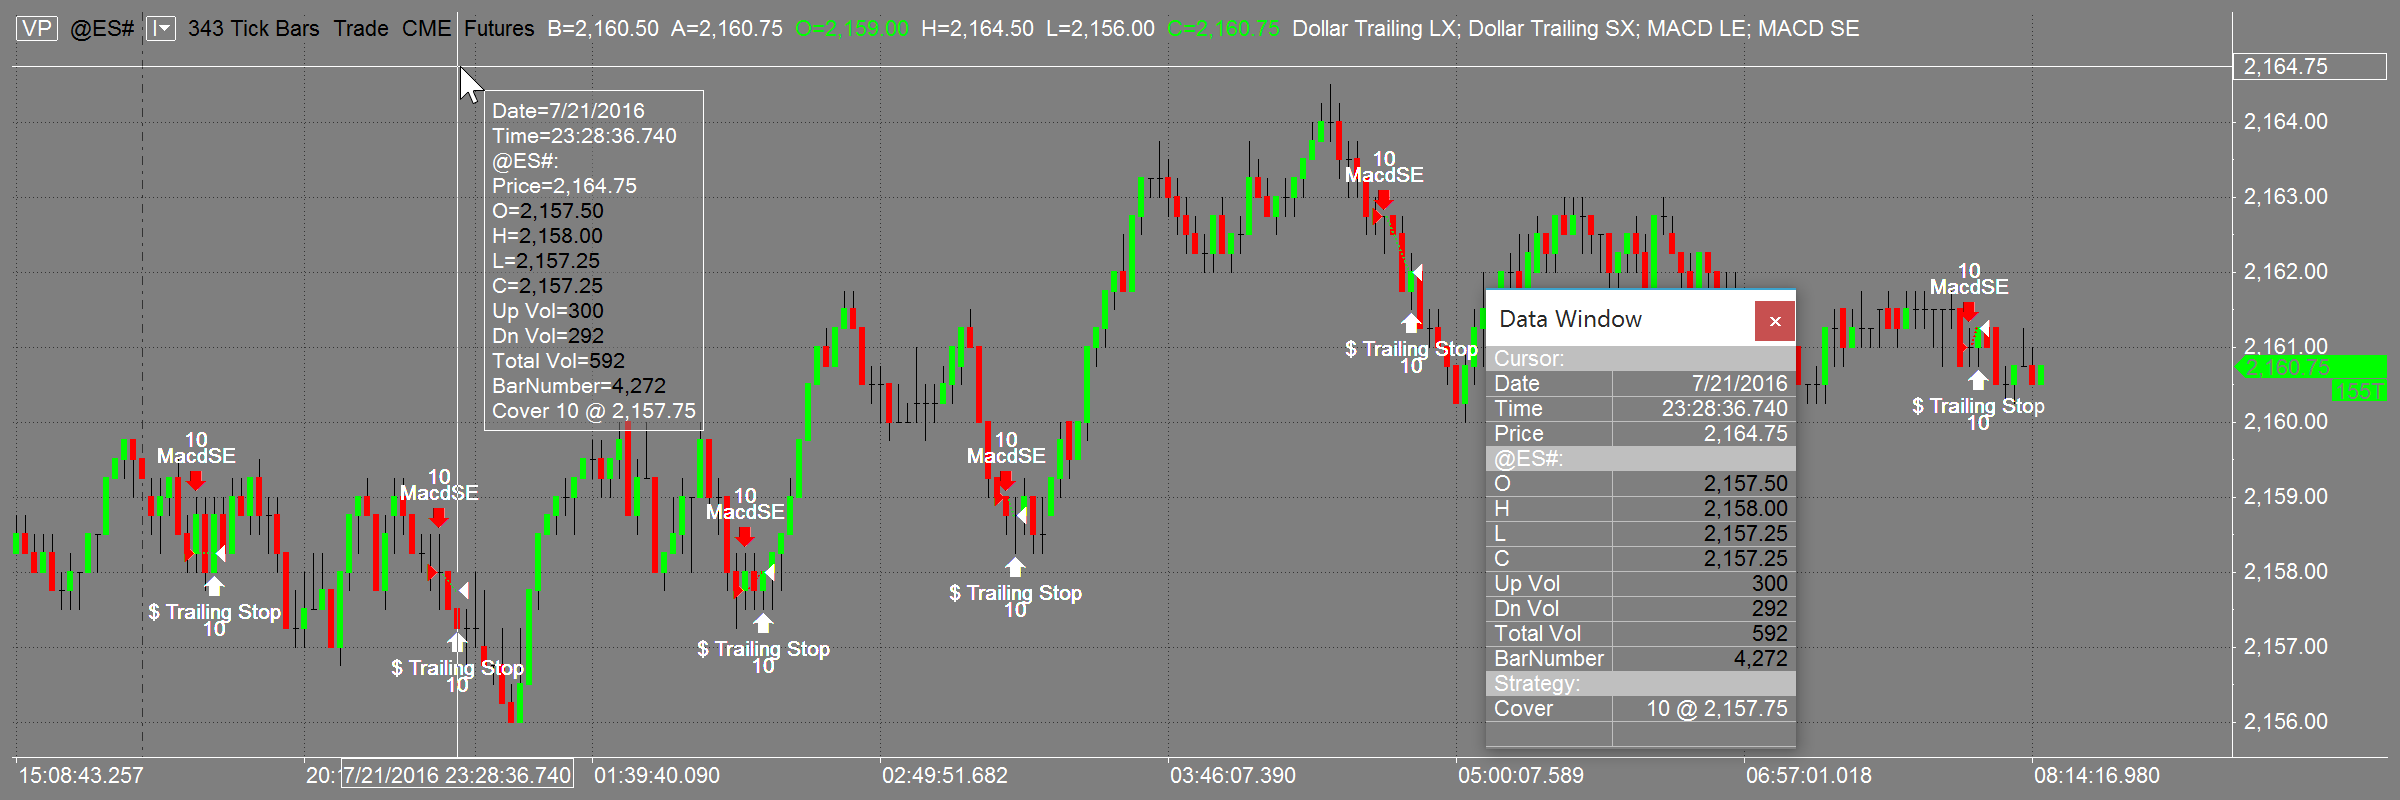
Details where you need them: Cursors, Data Window, and Hint Window
When working with charts, the ability to quickly pinpoint the exact price is critical. The Data Window remains on the side of the screen, showing you the current market situation. However, if you need to study a particular area on a chart, the Hint Window conveniently appears at the tip of your cursor.
MultiCharts
Your data window
Knowing the exact price at any given point in time is key to trading the markets. The Data Window conveniently stays put on the left side of the screen with all relevant information laid out in an easy-to-read format. It is attached to the main platform window for easy viewing, but it can also be detached and floated like any other chart.
The hint window
If you are analyzing an area on the chart and don’t want to keep looking over at the Data Window, simply click on the chart and the Hint Window appears. It shows you price values, indicator values, and strategy-generated orders for the bar that you’re viewing. Also, the Hint Window can always follow your mouse, or you can make it only appear on demand.
A choice of cursor styles
From various cursor styles (including hand, cross, price tracking mode, and a global cursor that synchronizes many charts) to the floating Hint Window and the stationary Data Window, MultiCharts features a complete package that accurately and quickly tracks price changes and indicator values.
Background dragging
Many traders prefer to 'grab' the chart with the mouse cursor and move it around to look for opportunities. The background dragging button on the toolbar turns this mode on and off.
Choice of timestamps and trading sessions for wherever you are
You can display data series using either local or exchange timestamps. Also, in addition to hundreds of existing trading sessions, you can create custom ones to suit trading any instrument and in any time zone.
MultiCharts
View charts any way you like
Several custom trading session templates can be used at the same time for any one symbol, which means that you can get a different angle on your trading. For example, one chart can show pre-trading and regular hours, while another can show you just the regular hours. This can be useful for practicing and learning whether your predictions are correct. The sessions can be changed easily using the Format Instrument dialog window.
Timestamps for synchronizing
The choice of different timestamps can be very useful for trading financial instruments worldwide or synchronizing multiple charts to avoid confusion.
Create your own templates
If you want to trade only certain hours of the day or your exotic exchange is not supported by default, you can easily create your own templates. This means you can use MultiCharts in any part of the world, and you can trade any instrument on the worldwide electronic markets.