Context-sensitive charts
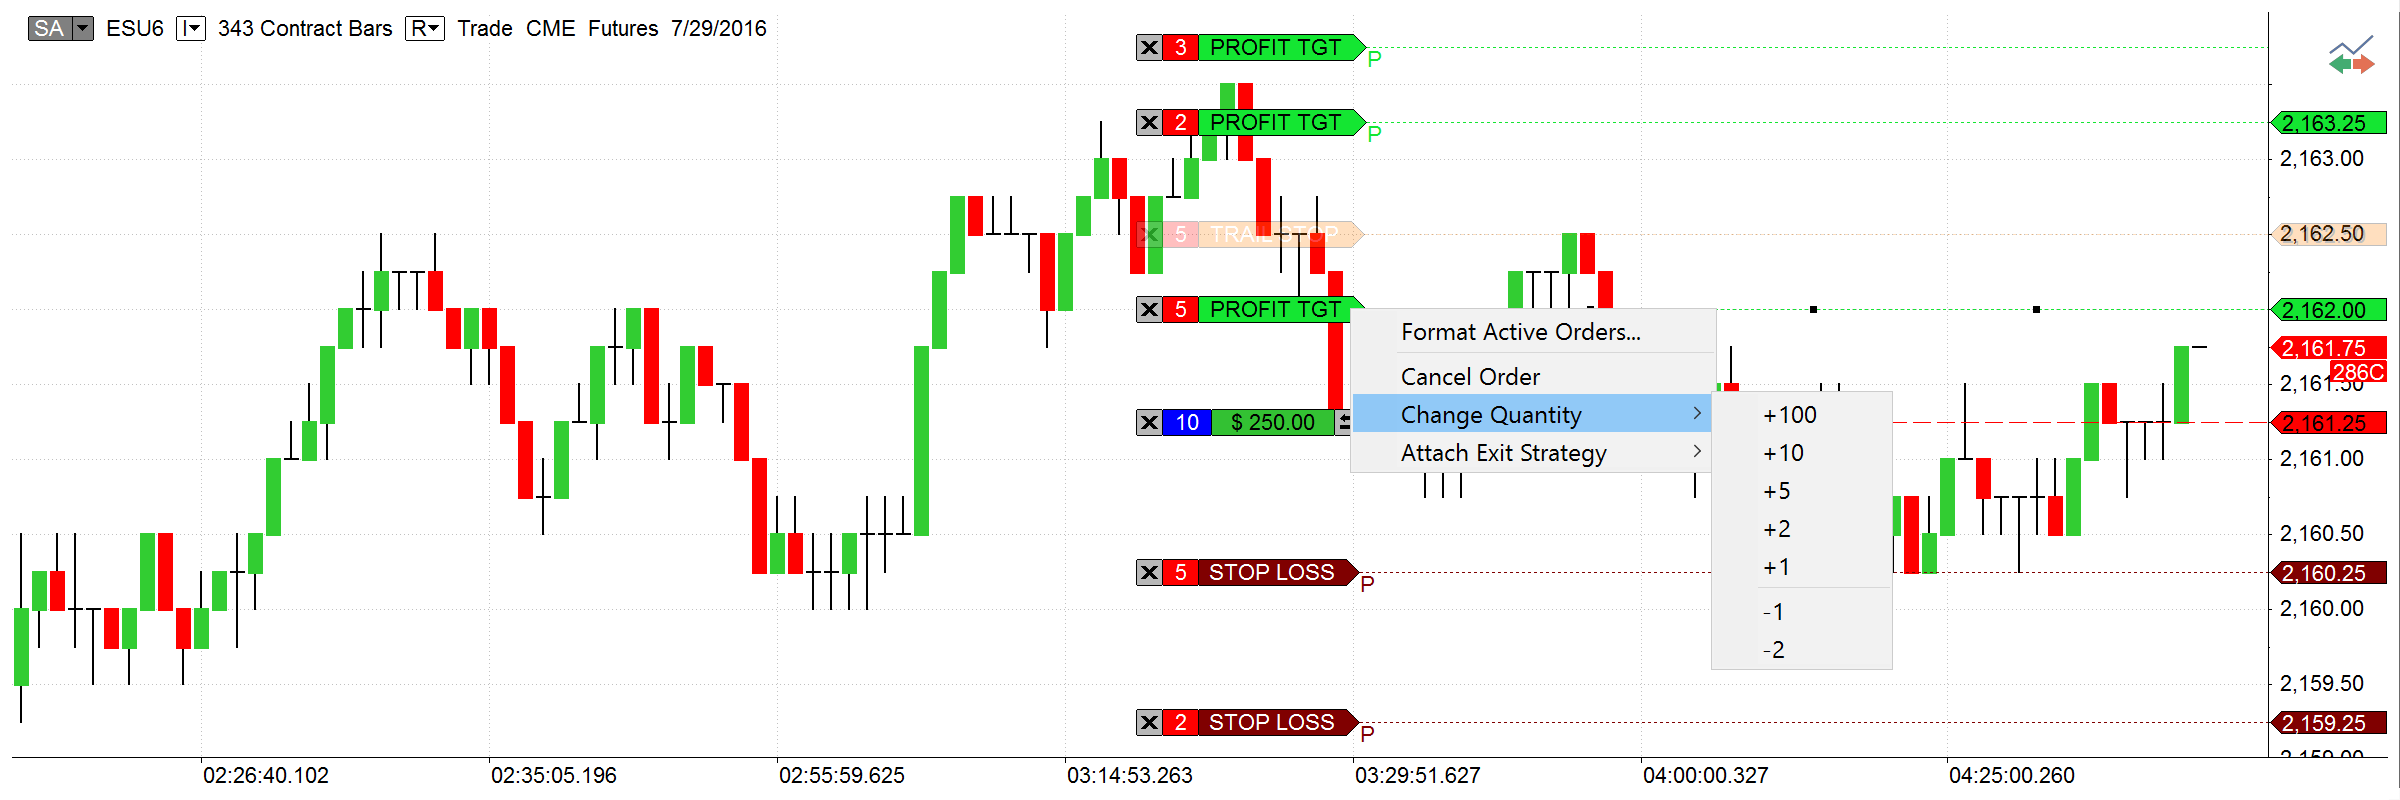
No more remembering prices to type them in later - surface of each chart tracks movements of your mouse and you can place orders at the exact levels you click on. Simply hover your mouse over the appropriate price, right-click and choose the order type and quantity. For technical information on this feature look at the related Wiki page.
MultiCharts
Placing orders via context menus
Try right-clicking on various objects and only the relevant options will appear. For example, the Place Order menu option only appears when connected to a broker. Click above the price and see Sell Limit and Buy Stop options, but if clicking below the price see Buy Limit and Sell Stop options.
Quickly drag-and-drop orders
Visual trading is essential because most traders spot important points with their eyes – where a pivot will occur, or a breakout might happen. You can easily and precisely drag and drop orders.
Easily adjust price levels
Now you can step away from the computer without missing a beat - convenient Sound Alerts will tell you if an order was filled, position was opened or closed, or if your connection went down. You can also fine-tune them to your liking, and be free to do other tasks without having to watch charts all the time.
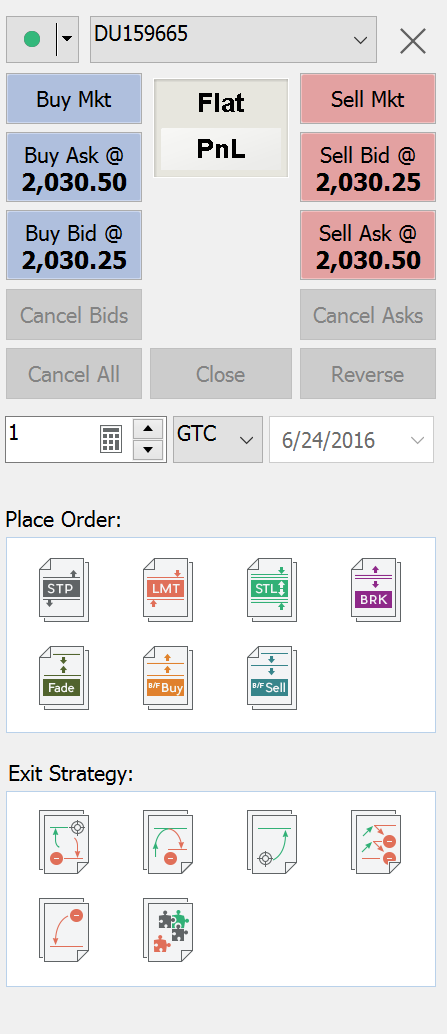
Chart Trading Panel
Apply any order or change any position quickly and easily using this carefully designed panel. An intuitive interface and color-coded buttons make things easy to locate. Stop, limit and stop limit orders are shown as small icons with appropriate names, and they can be dragged to price levels since they are price orders. Market orders can only be entered using the red and blue Buy and Sell buttons. To enter and exit positions you can also use One-Cancel-Other (OCO) order groups, which consist of combinations of limit and/or stop orders, and if one is filled the other one is cancelled. These are also shown as icons and will be discussed in more detail in the Entry and Exit Automation section.
Setting Order Quantity
Enter the number of contracts by hand or use a convenient calculator tool. The trader’s calculator automatically stores the last amounts used and allows quickly picking them from a menu. It is also easy to add a certain number of contracts to the amount already owned.
Time in Force
How long do you want your order to remain active? There are several options - DAY (good for the rest of the day), GTC (good till cancelled), GTD (good till date), IOC (instant or cancel). You should note that these options are not always enabled, it depends on the order that you are placing.
Account Selector
Some brokers support a group of accounts and Financial Advisor accounts like Interactive Brokers. All available accounts are automatically listed in the Accounts drop-down list. Simply click on it and choose the account you want to trade.
Compact mode
Screen space is a prized commodity when you have many charts, scanners and DOM windows open at the same time. Compact Mode lets you save a little more by hiding some interface buttons and leaving visible only essential ones. You can always switch to Full mode by right-clicking and choosing the appropriate option.
Trade through any broker
Trade through any supported broker from any chart – just pick the appropriate one from the drop-down list. All the existing brokers are shown in the list. Even if it’s not connected at the moment you can activate it by selecting it from the menu.
Symbol Mapping
Sometimes data feeds and brokers have different names for the same symbol – and orders can get rejected for incorrect symbol reference. MultiCharts defines how an order will appear to a broker, so it is possible to use any combination of data feeds and brokers.
|
|
|
|
|
|
|
|
|
|
|
|
|
|
|
Basics of entry strategies
Entry strategies are pre-designed One-Cancel-Other (OCO) order groups to enter positions. They consist of combinations of limit and/or stop orders and if one is filled the other one is cancelled. They are shown as icons in the Trade Panel and can be dragged onto the chart to apply them. There are currently four entry strategies — Breakout, Fade, Breakout Up/Fade, and Breakout Down/Fade. To learn more about them read the Automation of Entries and Exits section.
Exit strategies are essential
Exit strategies were designed to protect against sudden market movements and to exit a position in a structured and organized fashion. They allow managing risk, scaling into and out of positions and leaving the computer while trades are in place. Just like entry strategies, these exits are OCO groups, consisting of limit and/or stop orders. Drag-and-drop exit strategies to existing orders, apply them with a right-click, or auto-apply them to every new order. Learn more about them in the Automation of Entries and Exits section.