Page 1 of 1
NumbersBars (Delta in subchart)
Posted: 28 Apr 2012
by SP
The indicator shows the upticks / downticks / delta ... for the bars and for the day.
The inputs are:
PlotOnlyToday - if true it plots the values only for the last trading day to reduce the text plottings
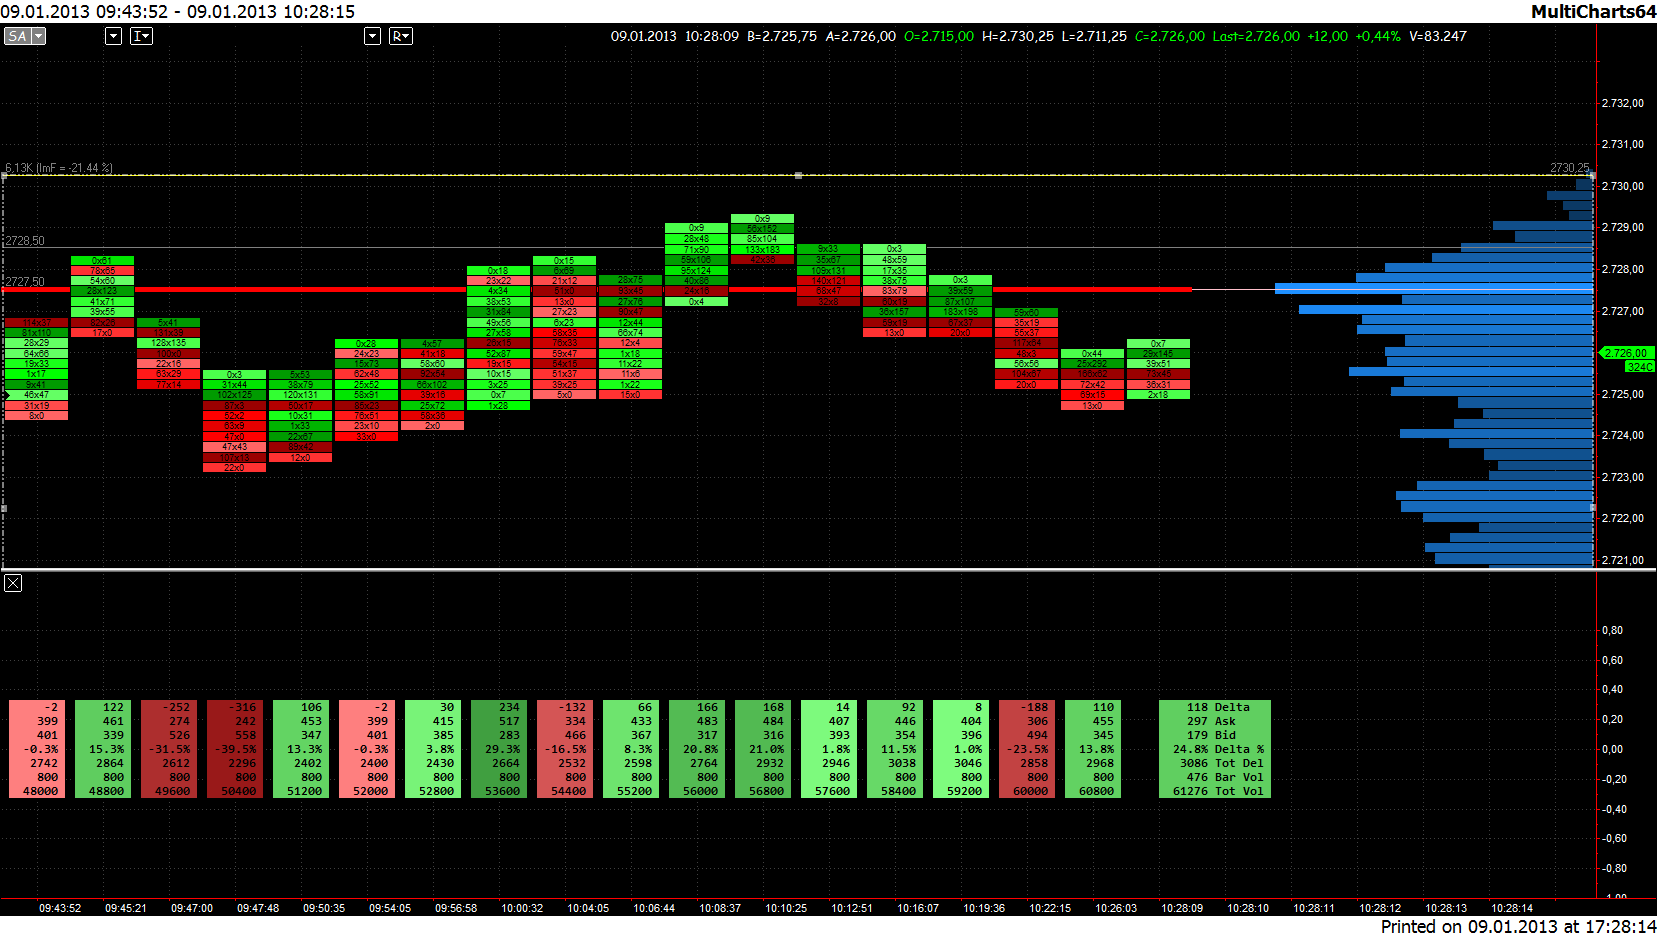
Show.AddText - show the explanatory text for the columns on the right of the chart ( blue box )
Show.UpTminusDnT - difference between the upticks and downticks for bar ( Delta )
Show.UpTminusDnTBarDiff - Delta for bar compared to the Delta for prior bar
Show.UpT - total upticks for bar
Show.DnT - total downticks for bar
Show.UpTPerc - percentage of the upticks of the total volume for bar
Show.DnTPerc - percentage of the downticks of the total volume for bar
Show.UpTminusDnTPerc - percentage of Delta of total volume for bar
Show.DayCumulative - cumulative Delta since sessionstart
Show.AvgVolperPrice - average volume for each price of the bar
Show.UpTplusDnT - total volume per bar (upticks+downticks)
Show.VolBarDiff - total volume per bar compared to the total volume for prior bar
Show.TotalDeltaPercTV - percentage of cumulative Delta of total volume since sessionstart
Show.MaxDelta - cumulative Delta high since sessionstart
Show.MinDelta - cumulative Delta low since sessionstart
Show.TotVol - total volume since sessionstart
Re: NumbersBars (Delta in subchart)
Posted: 28 Apr 2012
by SP
Re: NumbersBars (Delta in subchart)
Posted: 26 May 2012
by piranhaxp
Nice work Stefan ... The only 1 point I'm thinking about is the usage of different colors.
Mike
Re: NumbersBars (Delta in subchart)
Posted: 09 Jan 2013
by SP
Hi Mike,
added a color option and made it working with Cumulative Delta charts and Breakdown by Ask Traded vs Bid Traded for Version 8.5 Beta 2.
Code: Select all
// V2 beta by SP for RTH Session Charts

// Numbers Bars for Volume Breakdown Ask vs Bid

// Open a Volume Delta or Regular Chart as data 1

// Open a Cumulative Delta as data2, same Resolution as data 1, Breakdown by Ask Traded vs Bid Traded, Break on Session checked

// Needs one date change (d<>d[1]) to reset, so data range 4 days back should work -- double check christmas and new years holidays


// Properties: Base the study on data 2 - Cumulative Delta, Update on every tick checked, Skip identical ticks unchecked


Inputs:

PlotOnlyToday  		( true ),	// Plot only today to reduce text drawing

SessStart				( sess1starttime ),

SessEndtime			( sess1endtime   ),

UseDelay				( true ),	// Avoid to draw the text every tick in fast markets, only draw every Seconds.Delay seconds

Seconds.Delay			( 1 ),

DataNum				( 2 ),	// data 2 - Cumulative Delta

TextSize				( 8 ),

TextSpace				( 7 ),

TextFont				( " Consolas"),

Row1.Text				( " Delta	  "),

Row2.Text				( " Ask	  "),

Row3.Text				( " Bid	  "),

Row4.Text				( " Delta % "),

Row5.Text				( " Tot Del "),

Row6.Text				( " Bar Vol "),

Row7.Text				( " Tot Vol "),

UpColor				( RGB(0,64,0)),

WeakUpColor			( RGB(128,255,128)),

DnColor				( RGB(128,0,0)),

WeakDnColor			( RGB(255,128,128)),

NeutralColor			( white ),

ColorLength			( 30 );


Variables:

TotalDelta	(0),

TotalVol		(0),

intrabarpersist Delay		(0),

HighestHi 	(0),

LowestLo 		(0),

DELTA 		(0),

MyAskTraded 	(0),

MyBidTraded 	(0),


DELTAText		(""),

DELTA_Text	(0),

DeltaColor	(0),


RTDELTAText	(""),

RTDELTA_Text	(0),

RTDeltaColor	(0),

BarsSinceLastReset 	( 0 );


Once

begin

		RTDELTA_Text = text_new_self_S (DATE, Time_S, 0, "") ;

		text_SetColor 		(RTDELTA_Text, black ) ;

 		text_setsize  		(RTDELTA_Text, TextSize);

 		text_setborder		(RTDELTA_Text, true);

 		Text_Setbgcolor 	(RTDELTA_Text, DeltaColor );

 		text_SetStyle 		(RTDELTA_Text, 2, 2) ;

   		text_setfontname	(RTDELTA_Text, TextFont );

   		Text_SetAttribute	(RTDELTA_Text,1,True);

end;


if (DATE > DATE[1]) OR TIME[1] = SessEndtime then

begin

		TotalDelta 		= 0 ;

 		TotalVol 			= 0 ;

 		HighestHi 		= 0;

		LowestLo  		= 0;

		BarsSinceLastReset 	= 0;

end ;


if time >= SessStart and time <= SessEndtime then

begin

	If BarsSinceLastReset = 0 then

		DELTA = Close

		else

		DELTA = Close - Close[1];


	TotalDelta 	= 	Close;


 	TotalVol 		= 	TotalVol+TICKS ;

 	if High > HighestHi then highesthi  = High;

	if Low < LowestLo   then LowestLo   = Low;


	BarsSinceLastReset = BarsSinceLastReset + 1;


	//We need the Volume traded at bid and at Ask

	// !! Dont use Upticks/Downticks (beta2), we need extra calculation as follows:


	If DELTA > 0 then

	begin

		MyAskTraded = (Ticks-DELTA)/2 + DELTA;

		MyBidTraded = (Ticks-DELTA)/2 ;

	end

	else If DELTA < 0 then

	begin

		MyAskTraded = (Ticks+DELTA)/2 ;

		MyBidTraded = (Ticks+DELTA)/2 - DELTA;

	end

	else If DELTA = 0 then

	begin

		MyAskTraded = (Ticks)/2 ;

		MyBidTraded = (Ticks)/2 ;

	end	;

end ;


if (PlotOnlyToday  = false or (PlotOnlyToday  = true and date=LastCalcDate )) and barstatus (DataNum) = 2 then

begin


 		DELTAText = NumToStr ( DELTA, 0);

		DELTA_Text = text_new_self_S (DATE, Time_S, 0, "") ;

		if TIME >= SessStart then

 		Text_SetString 	(DELTA_Text,

 						//newline+

 						Spaces(TextSpace - StrLen(DELTAText))+DELTAText+spaces (1)				  +newline+

 						Spaces(TextSpace - StrLen(NumToStr ( MyAskTraded , 0)))+NumToStr ( MyAskTraded , 0) 	+newline+

 						Spaces(TextSpace - StrLen(NumToStr ( MyBidTraded , 0)))+NumToStr ( MyBidTraded , 0) 	+newline+

 						Spaces(TextSpace - StrLen(NumToStr ( ((DELTA) /TICKS )  *100, 1))-1)+NumToStr ( ((DELTA) /TICKS )  *100, 1) +"% "+newline+

 						Spaces(TextSpace - StrLen(NumToStr ( TotalDelta, 0)))+NumToStr ( TotalDelta, 0) 	+newline+

 						//Spaces(TextSpace - StrLen(NumToStr ( highesthi , 0)))+NumToStr ( highesthi , 0) 	+newline+

 						//Spaces(TextSpace - StrLen(NumToStr ( lowestlo, 0)))+NumToStr ( lowestlo, 0) 	+newline+

 						Spaces(TextSpace - StrLen(NumToStr ( ticks , 0)))+NumToStr ( ticks , 0) 	+newline+

 						Spaces(TextSpace - StrLen(NumToStr ( TotalVol, 0)))+NumToStr ( TotalVol, 0) );

 		if DELTA > 0 then

 			DeltaColor = gradientcolor ( DELTA , 0 ,  Highest (DELTA, MaxList( Barssincelastreset, ColorLength) ),  WeakUpColor,UpColor) else

 		if DELTA < 0 then

 			DeltaColor = gradientcolor ( DELTA ,      Lowest  (DELTA, MaxList( Barssincelastreset, ColorLength)) , 0 , DnColor,WeakDnColor) else

 			DeltaColor = NeutralColor ;


 		text_SetColor 		(DELTA_Text, black ) ;

 		text_setsize  		(DELTA_Text, TextSize);

 		text_setborder		(DELTA_Text, true);

 		Text_Setbgcolor 	(DELTA_Text, DeltaColor );

 		text_SetStyle 		(DELTA_Text, 2, 2) ;

   		text_setfontname	(DELTA_Text, TextFont );

   		Text_SetAttribute	(DELTA_Text,1,True);


end; //if (PlotOnlyToday  = false or (PlotOnlyToday  = true and date=LastCalcDate ))


If   ( (UseDelay = true and ComputerDateTime > Delay ) or UseDelay = false ) or barstatus(Datanum)=2 or barstatus(Datanum)=0 then

begin

if LastBarOnChart_s then

begin

		RTDELTAText = NumToStr ( DELTA, 0);


		if TIME >= SessStart then

 		Text_SetString 	(RTDELTA_Text,

 						//newline+

 						Spaces(TextSpace - StrLen(RTDELTAText))+RTDELTAText										+Row1.Text+newline+

 						Spaces(TextSpace - StrLen(NumToStr ( MyAskTraded , 0)))+NumToStr ( MyAskTraded , 0) 				+Row2.Text+newline+

 						Spaces(TextSpace - StrLen(NumToStr ( MyBidTraded , 0)))+NumToStr ( MyBidTraded , 0) 				+Row3.Text+newline+

 						Spaces(TextSpace - StrLen(NumToStr ( ((DELTA) /TICKS )  *100, 1))-1)+NumToStr ( ((DELTA) /TICKS )  *100, 1) +"%"+Row4.Text+newline+

 						Spaces(TextSpace - StrLen(NumToStr ( TotalDelta, 0)))+NumToStr ( TotalDelta, 0) 				+Row5.Text+newline+

 						Spaces(TextSpace - StrLen(NumToStr ( ticks , 0)))+NumToStr ( ticks , 0) 						+Row6.Text+newline+

 						Spaces(TextSpace - StrLen(NumToStr ( TotalVol, 0)))+NumToStr ( TotalVol, 0) 					+Row7.Text);


 		if DELTA > 0 then

 			RTDeltaColor = gradientcolor ( DELTA , 0 ,  Highest (DELTA, MaxList( Barssincelastreset, ColorLength) ),  WeakUpColor,UpColor) else

 		if DELTA < 0 then

 			RTDeltaColor = gradientcolor ( DELTA ,      Lowest  (DELTA, MaxList( Barssincelastreset, ColorLength)) , 0 , DnColor,WeakDnColor) else

 			RTDeltaColor = NeutralColor ;


		text_SetColor 		(RTDELTA_Text, black ) ;

 		text_setsize  		(RTDELTA_Text, TextSize);

 		text_setborder		(RTDELTA_Text, true);

 		Text_Setbgcolor 	(RTDELTA_Text, RTDeltaColor );

 		text_SetStyle 		(RTDELTA_Text, 0, 2) ;

   		text_setfontname	(RTDELTA_Text, TextFont );

   		Text_SetAttribute	(RTDELTA_Text,1,True);

   		Text_SetLocation_s 	(RTDELTA_Text,	d, time_s, 0);

end;


Delay = ComputerDateTime+(Seconds.Delay*0.0000115740) ;

end;
Re: NumbersBars (Delta in subchart)
Posted: 04 Feb 2013
by moneymarkets
Would you mind posting wsp for your chart.
Thanks
Re: NumbersBars (Delta in subchart)
Posted: 05 Feb 2013
by SP
This is my Workspace for the @ES# with IQfeed.
Re: NumbersBars (Delta in subchart)
Posted: 10 Mar 2013
by BMS
really nice and interesting, well done, tks.
It would be interesting if the histograms height coul be correlated with the value, I mean a greater delta a higher histogram and viceversa, and /or may be the negative delta under the zero.
good trading
BMS
Re: NumbersBars (Delta in subchart)
Posted: 11 Mar 2013
by BMS
compiled successfully but not working on my MC 8.5 build 6778 (Win7 ultimate 64bit)

Re: NumbersBars (Delta in subchart)
Posted: 05 Sep 2013
by coolmoss
I assume this indicator is coded for use with the Easy Language version of MultiCharts. Is a .Net version of this indicator available?