Page 1 of 1
Consolidated Tape
Posted: 29 Oct 2012
by SP
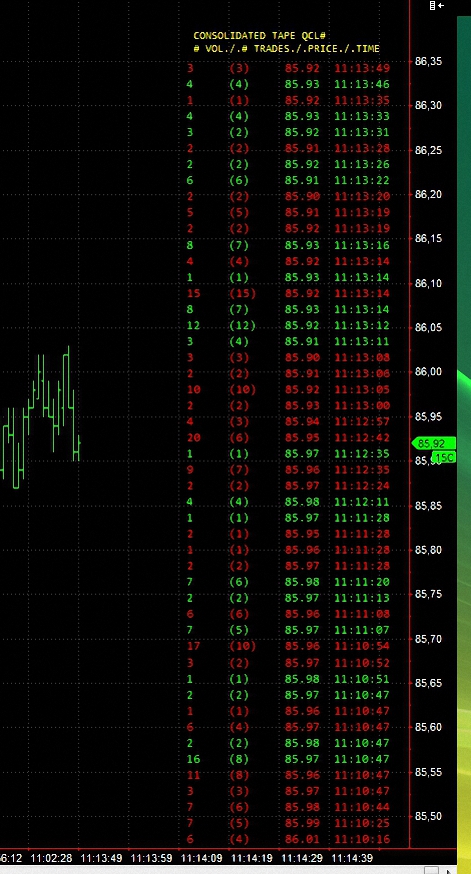
The indicator consolidates the time and sales.
As long as the price does not change the volume gets summed up. If the price changes the values reset and a new row is printed.
The indicator shows
- the total volume traded on the specific price since the last change,
- the number of trades,
- the traded price,
- the last traded time.
If the price is higher than the previous price (uptick) the row is colored with Up.Color, on a downtick with Down.Color.
Re: Consolidated Tape
Posted: 29 Oct 2012
by SP
ConsolTape
Re: Consolidated Tape
Posted: 29 Oct 2012
by TJ
The indicator consolidates the time and sales.
As long as the price does not change the volume gets summed up. If the price changes the values reset and a new row is printed.
The indicator shows
- the total volume traded on the specific price since the last change,
- the number of trades,
- the traded price,
- the last traded time.
If the price is higher than the previous price (uptick) the row is colored with Up.Color, on a downtick with Down.Color.
Very nice !
Thanks for sharing.
Re: Consolidated Tape
Posted: 18 Dec 2012
by arnie
Again, great work SP.
I must be doing something wrong here since I can't see anything. But I'll wait for the new version.
Re: Consolidated Tape
Posted: 18 Dec 2012
by SP
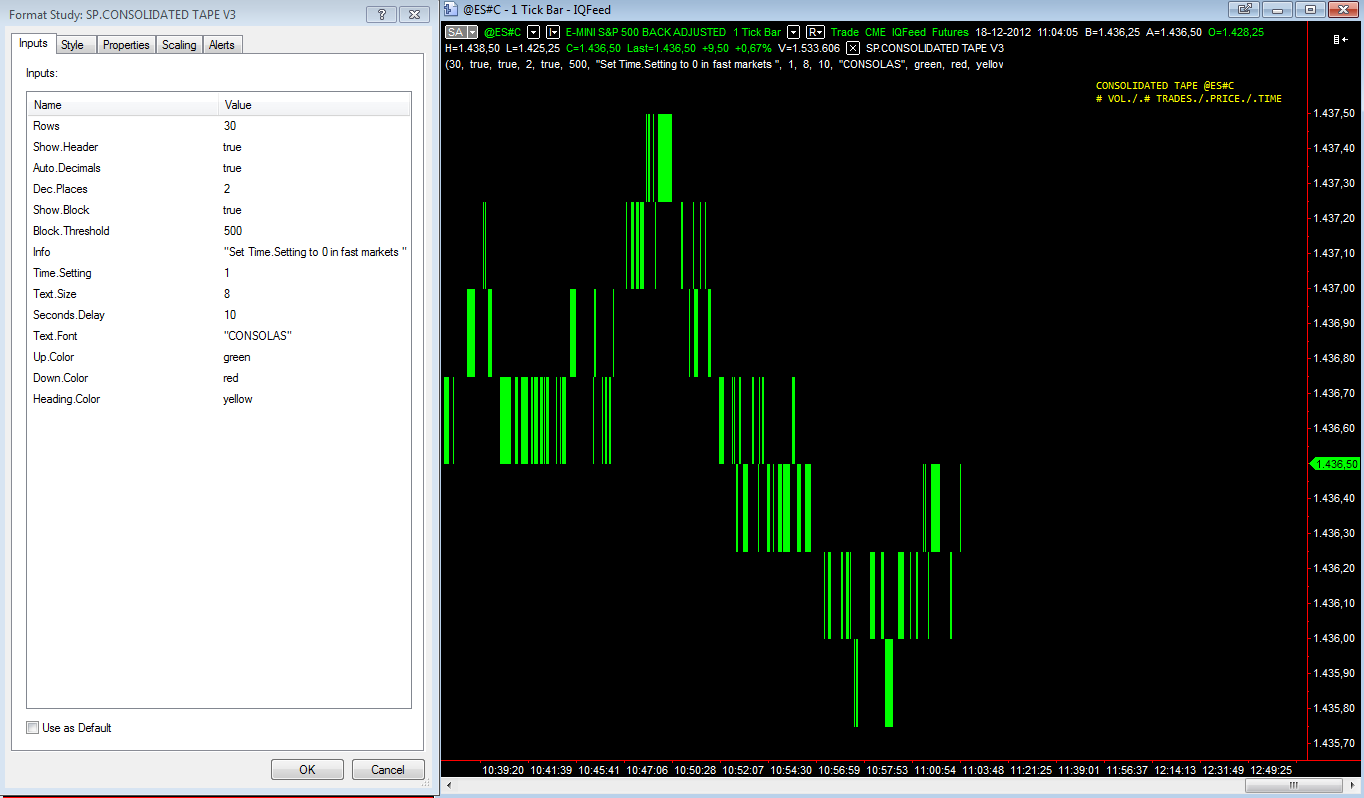
Switch to a higher timeframe, ie 2000 tick charts.
To get correct time settings for minute charts too, change
Code: Select all
if Time.Setting>1 then

	time.string = FormatTime ("HH:mm:ss",el_timetodatetime_s (time_s)) else

	time.string = FormatTime ("mm:ss",el_timetodatetime_s (time_s));
to
Code: Select all
if Time.Setting>1 then

         time.string = FormatTime ("HH:mm:ss",computerdatetime) else

         time.string = FormatTime ("mm:ss",computerdatetime);
Re: Consolidated Tape
Posted: 18 Dec 2012
by arnie
OK, working now. I thought the setup was the same, 1 tick chart.
Is there a specific reason on why waiting for beta 2 for the new version?
Re: Consolidated Tape
Posted: 19 Dec 2012
by SP
arnie,
this one is the first attempt for volume breakdown charts. It resets the cummulative calculation if
either the price has changed or the trades are at the same price, but traded at bid or traded at ask has changed.
It needs the following Chart Settings:
A Cumulative Delta chart with Resolution 1 Tick and Breakdown by: "Ask Traded vs Bid Traded" and Build Volume on: "Trade Volume" and "Break on Session" checked and Data Range: 1 Days back.
Decrease bar spacing as much as possible.
Take a look if it works.