Portfolio Trader
In MultiCharts 9.0 Portfolio Backtester has been improved and became Portfolio Trader adding Portfolio Automation and Forward Testing to the list of features.
Download Media:Portfolio_Trader_Manual.pdf in .PDF format.
Contents
- 1 Opening Portfolio Trader
- 2 Understanding Portfolio Trader
- 3 Portfolio Trader Calculation Modes
- 4 Understanding Dynamic Portfolio
- 5 Portfolio Script Calculation Diagram
- 6 Script Calculation and Raw Order Generation
- 7 Understanding Portfolio Money Management Signals
- 8 Symbol Prioritization
- 9 Risk Control
- 10 Currency Conversion
- 11 Portfolio Trader Strategy Examples
- 12 Portfolio Money Management Keywords
Opening Portfolio Trader
To open Portfolio Trader:
- click Portfolio Trader
 icon on the Main toolbar; or:
 - in the Main menu select File, then point to New and click Portfolio Trader.
Understanding Portfolio Trader
MultiCharts now offers real-time portfolio trading, allowing you not only to backtest your strategy on a number of financial instruments, but also manage your portfolio live. While other platforms provide only historical simulations of portfolio trading, in MultiCharts Portfolio Trader you can develop, test, optimize your strategy and trade live or in simulation environment.
Portfolio Trading Benefits
Applying a trade strategy to a number of financial instruments simultaneously offers the following advantages:
- A diverse portfolio will produce more consistent results.
- Infrequent trading opportunities will be more common across a number of symbols.
- Portfolio strategies can maximize profit and minimize risks by dynamically allocating a portfolio’s capital based on each instrument’s performance.
- Portfolio strategies can enter, scale-in, scale-out, or exit positions based on the portfolio’s overall performance.
- Portfolio strategies are generally more robust and less susceptible to over-optimization.
- By backtesting on a diverse portfolio, instruments best suitable for that particular trading strategy can be selected.
Portfolio Trader Calculation Modes
Backtesting
After calculating strategies based on historical data, the Portfolio Performance Report will be generated.
Forward Testing
After calculating strategies based on historical data, this calculation is continued on real-time data. Information about the results is shown on the Forward Performance Testing window.
The Forward Performance Testing window contains the main information on strategy performance for every instrument:
- Instrument – name of the instrument;
- Position – current market position of the instrument;
- Open P/L – open position profit/loss of the instrument;
- Net Profit – net profit of the instrument;
- Risk Capital - amount invested into the current position;
- Equity - current equity of the instrument (Net Profit + Open P/L);
- Custom Text - a text line generated by a signal (pmm_set_my_status) or PMM signal (pmms_strategies_set_status_for_all);
- Pause/Resume Trading Instrument button - allows the user to pause/resume order generation for the selected instrument;
- Close Position instrument button - allows the user to close the position for the selected instrument.
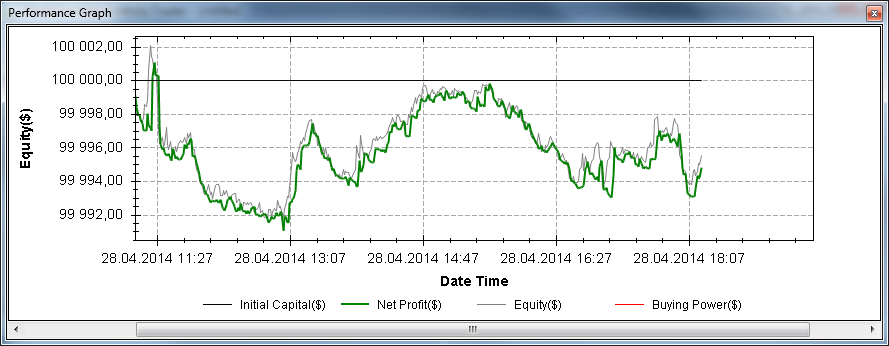
Performance Graph gives a visual representation of portfolio performance. The following values are shown:
- Initial Capital.
- Net Profit.
- Equity.
- Buying Power.
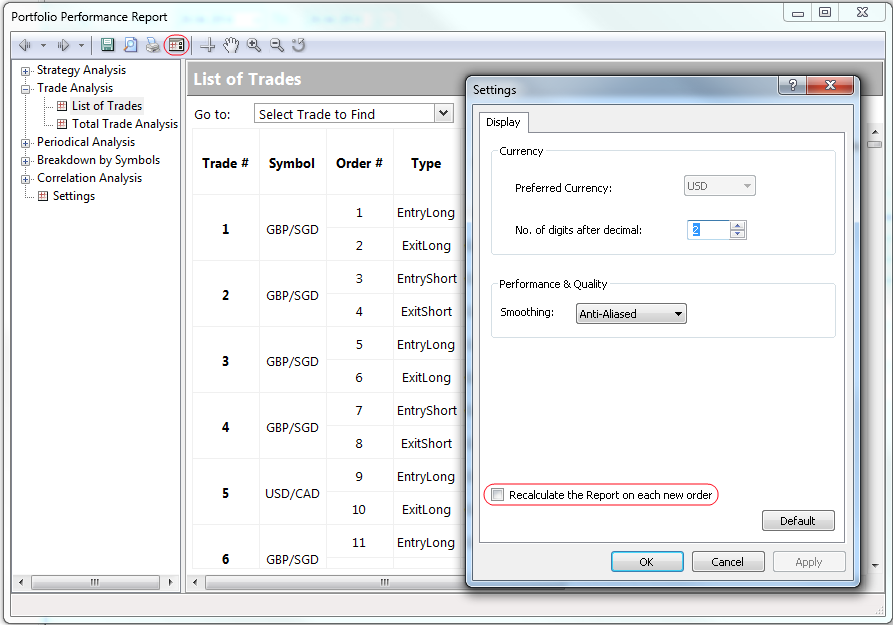
Portfolio Performance Report is available in Forward Testing Mode. Portfolio Performance Report shows the results generated from the moment it opens. The Portfolio Performance Report can be recalculated automatically on every new order generation if the Recalculate the Report on each new order check box is checked:
Automated Trading
After calculating the strategies based on historical data, the calculation is continued on real-time data, and orders are sent to the broker; for each strategy a separate broker profile can be selected.
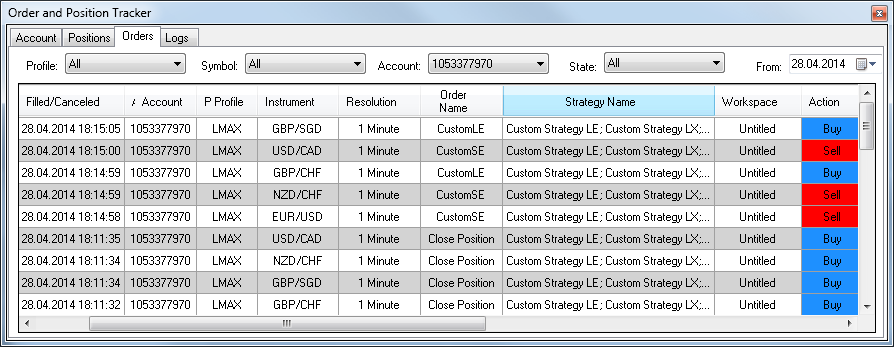
Order and Position Tracker Window contains detailed information on accounts, orders and positions at the broker.
Portfolio Performance Report is available in Auto Trading Mode. A Portfolio Performance Report shows results generated from the moment it opens.
Please, also note that there are 2 cases when the Report is not recalculated:
- when it is opened on Trade Analysis -> List of Trades page
- when it is opened on Breakdown by Symbols -> Overview -> detailed report for the symbol page.
Understanding Dynamic Portfolio
A dynamic portfolio strategy is more than a simple set of strategies applied to a number of instruments, taking into account a number of additional factors:
- Capital limits.
- Priority of Entry orders.
- Money and risk management.
- Overall portfolio exposure.
Batch Portfolio Backtesting, also known as Basket Backtesting, evaluates the performance of the strategy applied separately to each instrument and then compiles the results. It produces completely inaccurate results when the strategy needs to take into account overall portfolio exposure.
True Dynamic Portfolio Backtesting simulates the actions of a real trader by dynamically taking into account the portfolio’s overall results, rather than basked trading which simply compiles each instrument’s performance. Portfolio equity and the available capital are dynamically evaluated for every instrument, on every bar, in order to determine the available amount to be invested.
When the available capital is insufficient to enter all trading opportunities that arise simultaneously, the best opportunities are selected according to user-customizable criteria.
In addition to the performance of a particular instrument, portfolio drawdown or other portfolio performance aspects can be taken into consideration when making entry and exit decisions.
Portfolio Script Calculation Diagram
To see Portfolio Script Calculation Diagram please click here.
Script Calculation and Raw Order Generation
Here is a sequence of actions that will be performed during calculation:
- Before a portfolio is calculated, data from all instruments contained in the Instrument List are either gathered from MultiCharts database or downloaded from a data provider's server. The strategy is then applied to every instrument in the Portfolio Tree.
- During backtesting, a single bar of each symbol's data series is evaluated by the strategy's signal scripts, starting with the first (oldest) bar. The series’ bars are evaluated in the order that the symbols appear in the symbols table of Portfolio Trader. Based on evaluation of each series’ bar, a set of one or more orders may be generated by the scripts for each of the symbols. Order sets are generated in the same sequence as the series’ bars are evaluated.
- This process is illustrated in the Raw Order Generation section of the diagram: the first bar for symbol 1 is evaluated first, and a set of orders is generated based on that bar. Then the first bar for symbol 2 is evaluated, and a set of orders is generated based on that bar. The process is repeated until the first bar for the last symbol (Symbol N) is evaluated.
- After all of the strategies have been calculated, the PMM (Portfolio Money Management) signal is initiated (if any has been applied under Portfolio Properties). The PMM signal is used to apply money management settings to the entire portfolio. It can access all of the portfolio's strategies via pmms_keywords. (Calculation-wise, the PMM signal is not copied to every signal and is always calculated on the first instrument on the same bar on which all other signals are calculated).
- The PMM signal evaluates all of the portfolio’s strategies and affects generated orders (e.g., places orders which force positions to close, prevents opening positions or modifies the number of contracts). Raw orders that pass the PMM signal evaluation are then evaluated by the MONEY & RISK management system, with priority determined by MONEY & RISK's settings (priority is set by the PortfolioEntriesPriority keyword). If priority is set the same for all strategies, higher priority is given to the strategy located on top of the Portfolio Tree. Note that the PMM signal and the PortfolioEntriesPriority keyword are both applied to the portfolio. PortfolioEntriesPriority keyword is a legacy and it can interfere with the PMM signal. We do not recommend you use it.
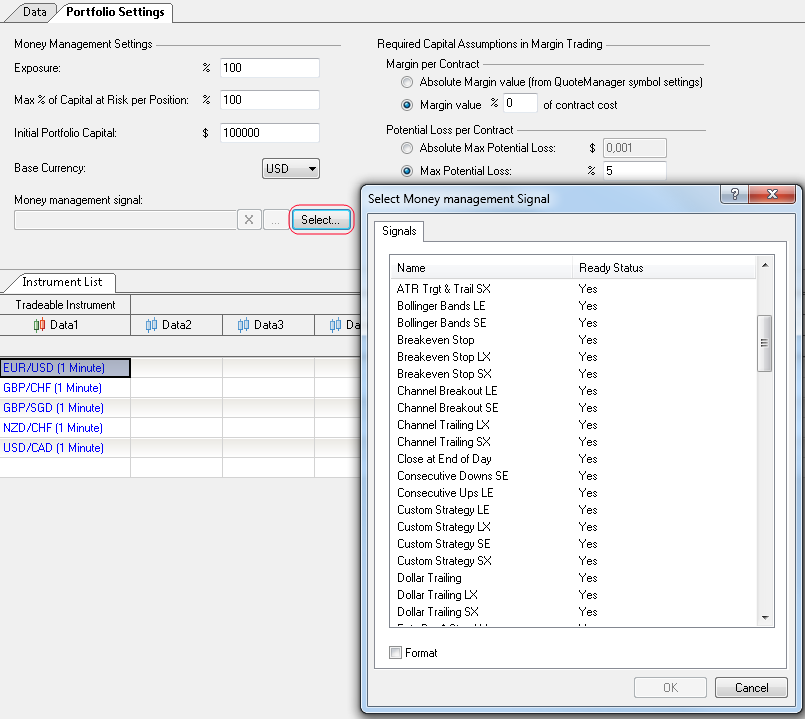
- The number of contracts is corrected in accordance with Money Management and margin (in Portfolio Settings).
- The order is sent either to a broker simulator (in Backtesting), a demo broker account or a live broker account (in Automated trading).
Understanding Portfolio Money Management Signals
The Portfolio Money Management Signal (PMMS) is calculated on every calculation step after all signals have been calculated. Please note that PMMS’s functionality was designed NOT to replace the main strategies, but to COMPLEMENT them.
PMMS was designed to:
- Select the instrument for investing a certain amount of money.
- Calculate the position size of each instrument.
- Force a position to be closed for a certain instrument.
- Change position size for a certain instrument.
- Prevent opening positions for a certain instrument.
- Allocate equity between instruments.
The Portfolio consists of the following key elements:
- The List of traded instruments.
- The Strategy applied to every instrument from the list.
- Portfolio equity.
Each strategy is designed to open and close positions of a specific instrument, i.e. the strategy calculates the moment WHEN the position should be opened/closed.
After all strategies have been calculated, the PMM (Portfolio Money Management) signal (if any PMM signal has been applied) is initiated.
The PMM signal can access all the strategies within a portfolio. PMMS functionality helps to manage:
- Rotation strategy (when N “Best” instruments are traded simultaneously).
- Index Strategy (The index is analyzed and instruments included in this index are traded).
- Pair trading (A position is opened on two instruments simultaneously).
PMMS can be selected in the Portfolio Properties window.
Since MultiCharts 11 Portfolio Money Management signals can generate alerts. To enable alerts for the PMM signals it is required to use Alert keyword in the code of the signal and enable alerts in the Alerts tab in Strategy properties.
Symbol Prioritization
If the PortfolioEntriesPriority function is specified within a strategy, the sequence of the sets of orders is rearranged based on the criteria specified. This process is illustrated in the Symbol Prioritization section of the diagram: the resulting sequence of sets of orders begins with the set of orders for the symbol 1, followed by the set of orders for symbol N, and ends with the set of orders for symbol 2. The position of a set of orders in the sequence determines its relative priority: the set of orders for symbol 1 has the highest priority (1), set of orders for symbol N has the second highest priority (2), and the set of orders for symbol 2 has the least priority (3).
Risk Control
At the risk control stage, the sequence of sets of orders is treated as one long sequence of orders. Orders are executed one-by-one from the beginning of the sequence, until all orders are executed, or until the risk control limits defined in Portfolio Settings prevent the execution of remaining orders. Any remaining orders that could not be executed are discarded. This process is illustrated in the Risk Control section of the diagram: all of the orders for symbol 1 and symbol N are executed, while only some of the orders for symbol 2, 100 shares Long @ 55, are executed, due to risk control limits; this prevents the execution of the rest of the orders for symbol 2. The entire process is repeated for the next bar of each of the portfolio symbol's data series.
Currency Conversion
Currency conversion is used when instruments in the Portfolio are traded in different currencies or Portfolio’s account currency does not match the currency of Portfolio symbols. For example, if the Portfolio account is in EUR and the instruments (GOOG and CSCO) are traded in an American Exchange, then to buy/sell Stocks the account currency (EUR) is converted to the Exchange currency (USD). A Portfolio can be even more complex, containing instruments from various Exchanges and trading in different currencies. If account currency and instrument currency are the same, then a conversion is not executed. Currency settings are taken from:
- Account currency is set in Portfolio Settings. Go to View then select Portfolio Settings and combo-box Base Currency.
- Symbol currency is set in Exchange settings in QuoteManager. Go to Tools then select Exchanges & ECNs and combo-box Currency.
- For FOREX currency pairs cross-rates are used.
All major strategy calculation indicators, such as Portfolio Net Profit, Gross Profit, Gross Loss, Trades Profits and Losses, etc. are calculated in the account currency, including EXISTING MaxIDDrawDown, NetProfit, MaxPositionProfit; PosTrade***;_OpenEntry***.
Strategy values (during backtesting, optimization, forward testing, realtime trading) are converted using historical data. The corresponding exchange rates at the close of the previous FOREX trading session will be used, intra-day exchange rate fluctuations are not taken into account: e.g. if the trade occurs on April 30th, the close price of the April 29th FOREX trading session will be used.
Currency conversion patterns:
Example 1: Currency conversion in PowerLanguage script.
To correctly set a Stop Loss of 1% from the Portfolio’s capital, it is necessary to write:
var: need_convert(false), equity(0);
equity = Portfolio_Equity;
if (SymbolCurrencyCode <> portfolio_CurrencyCode) then
equity = convert_currency( datetime, portfolio_CurrencyCode, SymbolCurrencyCode, equity);
setstopposition;
setstoploss(0.01 * equity);
Example 2: Portfolio parameters calculation when backtesting without conversion.
For example, Portfolio currency and instrument currency are the same, USD. The result of strategy backtesting is 1 trade.
Buy 1 lot at price $100 -> Sell 1 lot at price $110.
In this case, in the List of Trades under the Performance Report we should see, for example, a Net Profit=$10, and in the List of Trades this Trade will also be with the Profit=$10.
Example 3: Calculation of Portfolio parameters into Portfolio currency when backtesting.
Let’s use the same example, but with EUR as the Portfolio’s currency and the same trade on this instrument as before.
Buy 1 lot at price $100 -> Sell 1 lot at a price of $110, with currency rate at the moment, buying =1.25, and selling=1.275.
In this case, in the Performance Report Net Profit will be =6.27 EUR, and in the List of Trades the trade will be with a profit=6.27 EUR.
To purchase a dollar asset, it’s necessary to buy them using the current rate. For example, $100 was bought for 80 EUR. When selling, dollars are converted back to the Portfolio currency. For example, $110, using the rate of 1.275, is converted back to approximately 86.27 EUR.
Thus, if the rate had changed significantly after buying, for example up to 1.4, the executed trade would have been losing money: The buy would have been for ($100/1.25 =) 80 EUR and the following amount would have been made after selling ($110/1.4 =) 78.57 EUR.
Portfolio Trader Strategy Examples
Portfolio Trader Strategy Examples for regular MultiCharts (PowerLanguage) can be found here.
Portfolio Money Management Keywords
PMM Keywords and understanding of “pmm_set” and “pmm_get” for regular version of MultiCharts (PowerLanguage) can be seen here.


