How does it work?
The aim of any optimization is to adjust one’s trading system in an attempt to make it more effective. Strategy optimization is searching for optimum parameters for predefined criteria. By testing a range of strategy input values, optimization selects values that correspond to optimal strategy performance based on historical data. As a result, a trader gets many possible input combinations to find ones that result in the best performance.

Extensive choices
MultiCharts offers exhaustive and genetic optimization, as well as walk-forward testing. Each optimization type offers its own advantages and disadvantages, and each is great for accomplishing certain tasks. You can use them separately, or you can combine them to get a complete look at strategy performance. Walk-forward testing combines optimization and backtesting. During the process, optimal inputs are tested against real market conditions to see how they would perform.
Speed up optimization
MultiCharts uses multi-threading, which is a technology for distributing optimization cycles across all available CPUs. If you have multiple cores then all of them will be used as instances of your optimization running simultaneously. Data is loaded separately into each core at the same time for fast optimization, essentially creating a virtual chart. The 64-bit version of MultiCharts can easily handle huge volumes of data required for this operation, resulting in you using your time more efficiently and effectively during optimizations.
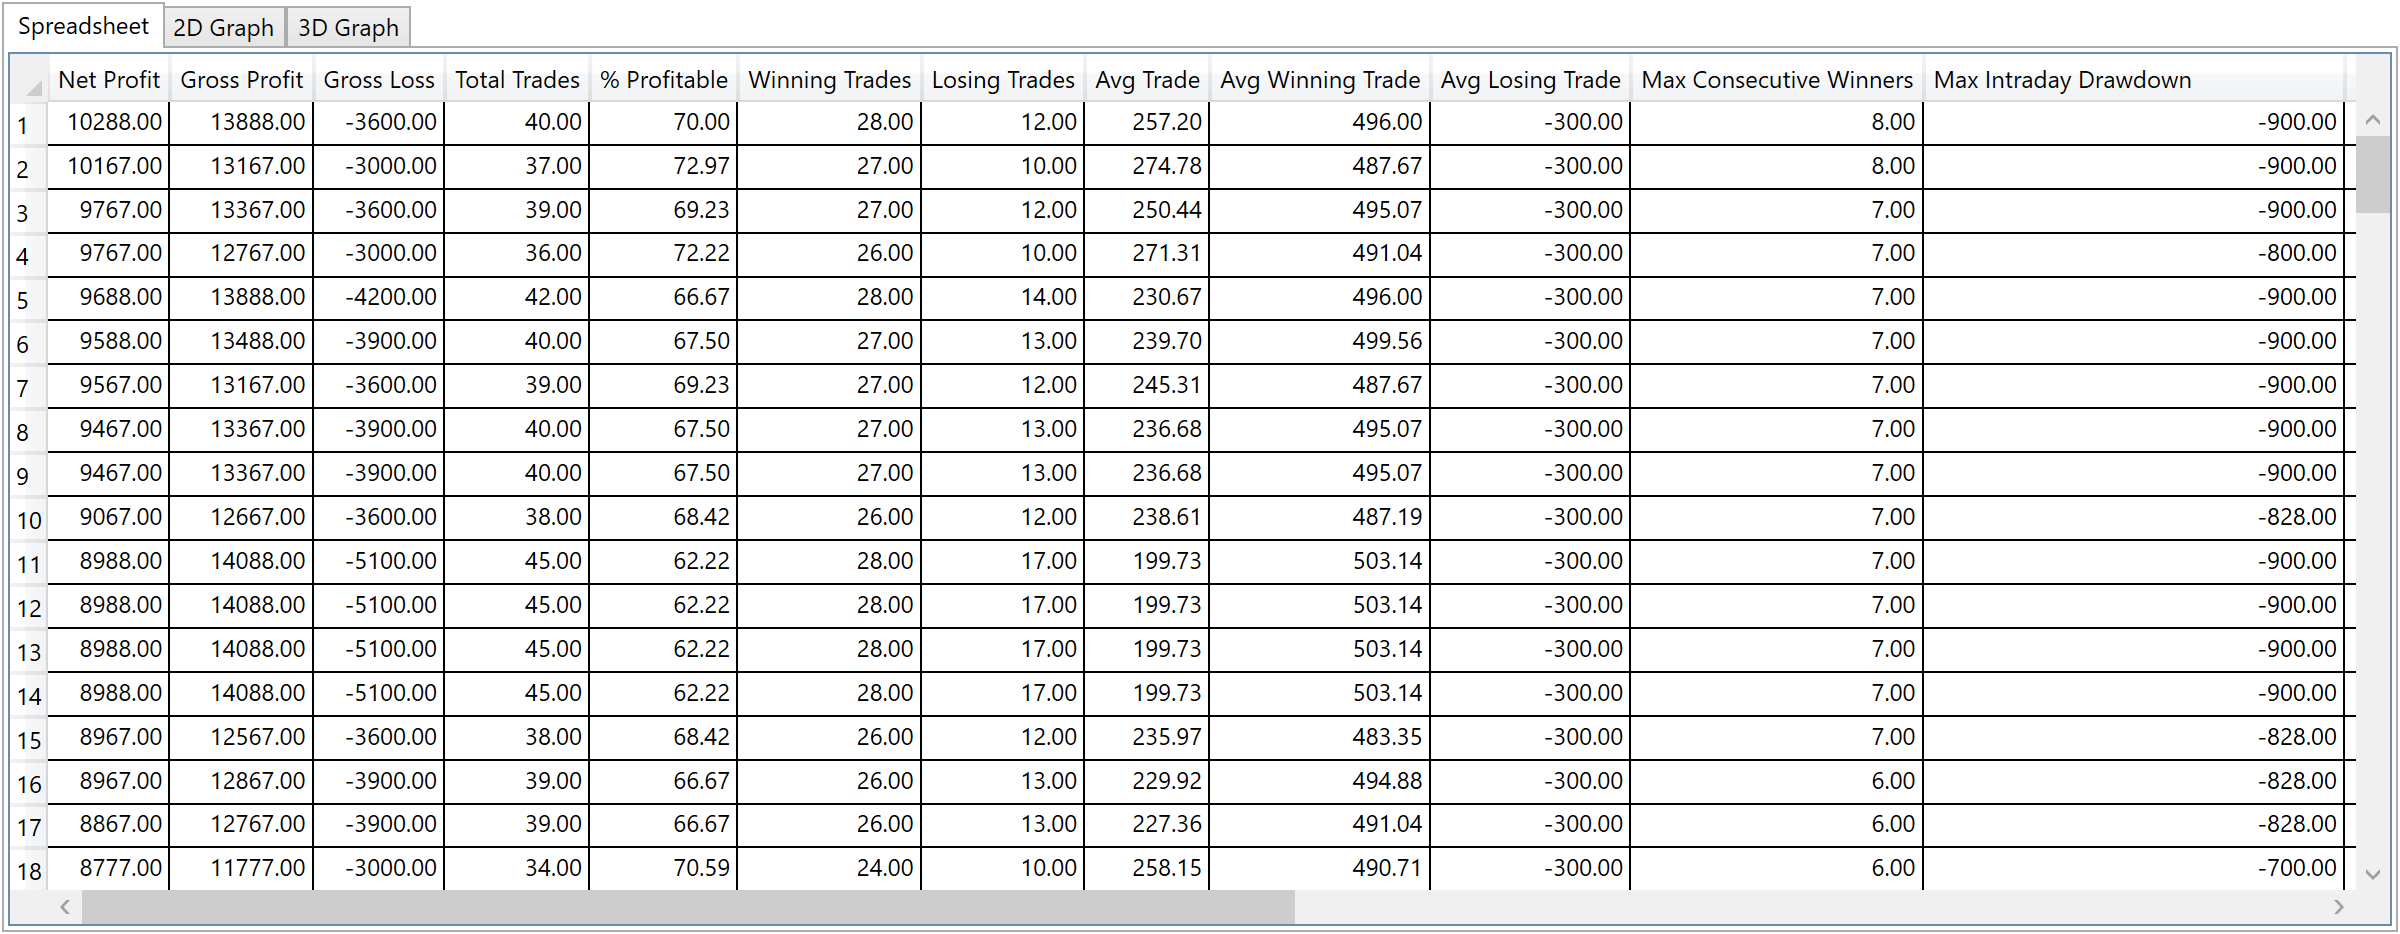
Optimization Report
This report shows the optimization results, columns represent 18 strategy performance fields as well as all the inputs which were optimized during the current run. Each row represents a set of test results for a given inputs combination. You can filter the outputs by one or more criteria. For example, to find a strategy with the maximum net profit and minimum max drawdown—first sort by net profit in ascending order and then by drawdown in descending order.
Choose between Exhaustive Search and Genetic Algorithm
Each optimization type has its benefits and drawbacks. You must choose the right tool to get the job done, and find the result you need. If you are testing many possibilities, exhaustive optimization takes a very long time —even with multi-threading. The advantage of exhaustive optimization is that it is guaranteed to find the absolute optimal inputs in the testing range. Therefore, it should be used where the number of possibilities is relatively small, or where you must find the absolute best solution. Another nuance is that the absolute best inputs might actually be an outlier, which does not result in good performance on a consistent basis. Genetic optimization addresses this issue because it performs strategy optimization differently.
Exhaustive (Brute-Force) Optimization
Strategy optimization is done to find good parameters, and eliminate bad ones. Exhaustive optimization systematically goes through all potential combinations as it searches for the solution with the highest results for the criteria you choose. You can find inputs that maximize net income, minimize drawdown, or result in fewest trades. The amount of time the exhaustive optimization feature needs to find the solution relates directly to the number of possible combinations it needs to test — the more combinations you have, the longer it will take. If only a few parameters are tested for a short range, this method is definitely optimal for finding the best inputs.
Genetic Optimization
Genetic Algorithms optimization evaluates only more promising combinations, finding near-optimum solutions in a fraction of time that would be required by the brute-force approach, making Genetic Algorithms optimization powerful enough to analyze strategies with hundreds of parameters. Genetic Optimizer settings add flexibility to this technique. The algorithm starts by testing a number of random combinations, select the most potential ones and then combine and modify them further to finally arrive at the best input settings. Instead of mechanically checking every conservable combination, genetic algorithms quickly narrow down the number of potential winners by finding and focusing on the areas that are most profitable and most stable. Thus, genetic algorithms avoid superfluous calculations in the lowest net profit potential zones.
Optimization Report
Fitness Function
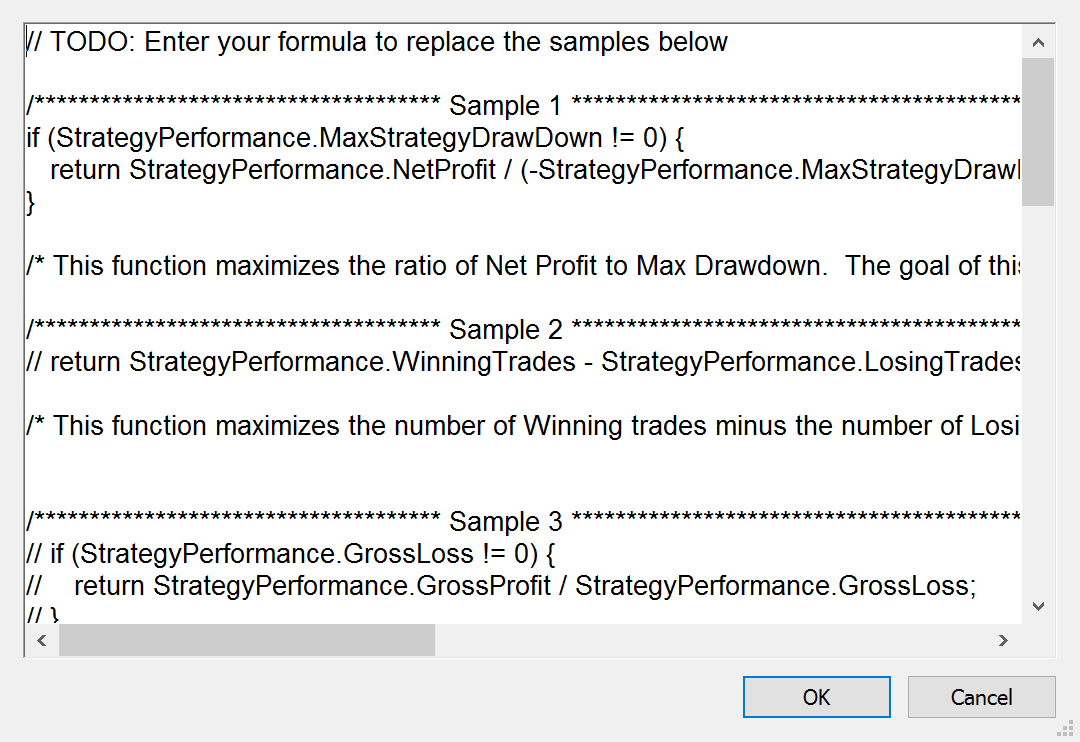
Custom Fitness Function Optimization
With this feature you can optimize your strategy using several conditions, as opposed to just one. For example, you can find a strategy that combines the greatest profit, lowest drawdown, and the highest percentage of profitable trades. You can use custom fitness function optimization in regular and portfolio backtesting—as well as with genetic and exhaustive trading system optimization. PowerLanguage has a keyword called SetCustomFitnessValue. This word can be used with other keywords, such as GrossProfit and TotalTrades, to create a custom equation for which your strategy will be optimized. You can also create a similar equation in Java script, if you are more familiar with that language. More specific information is found on the related Wiki page.
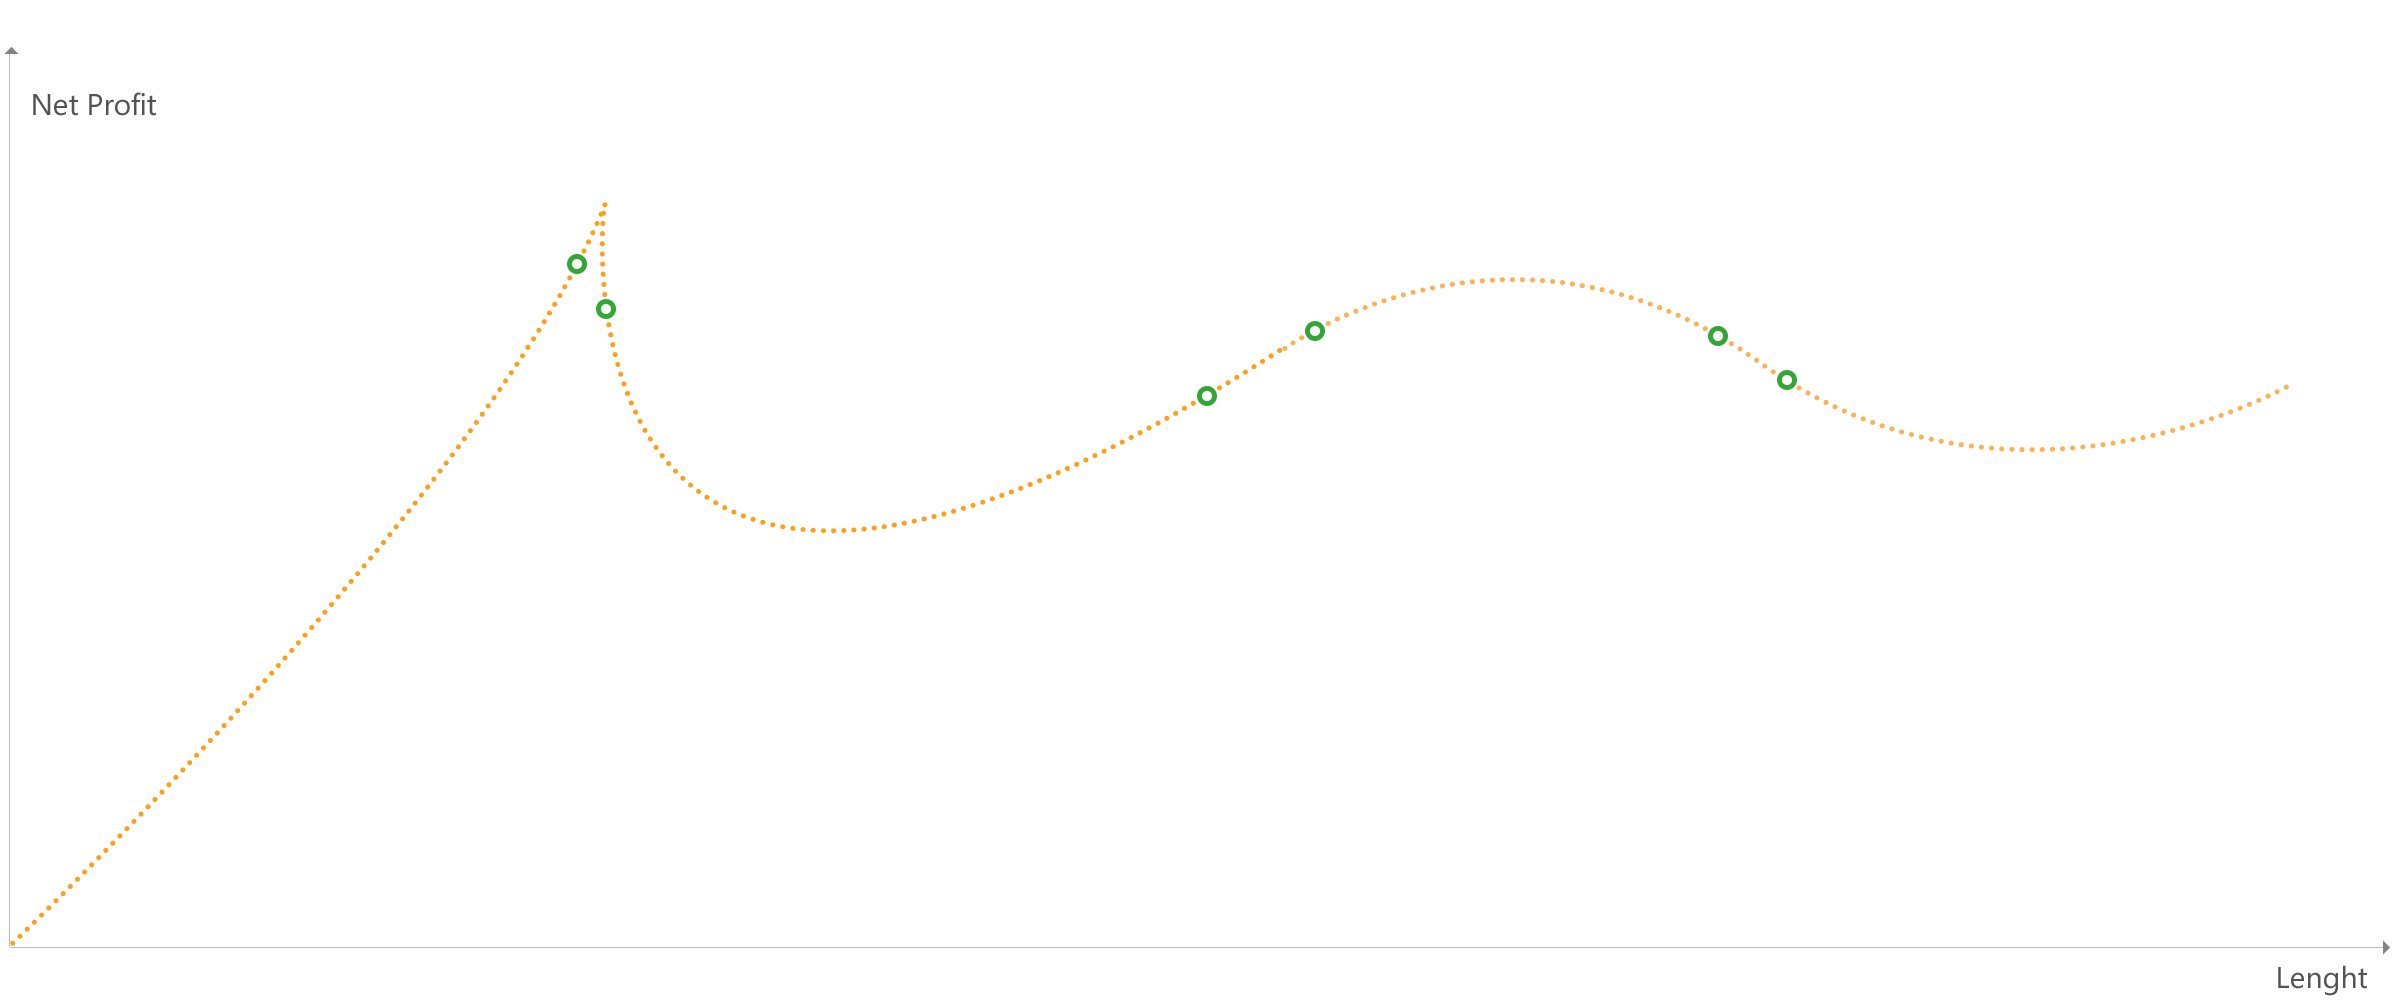
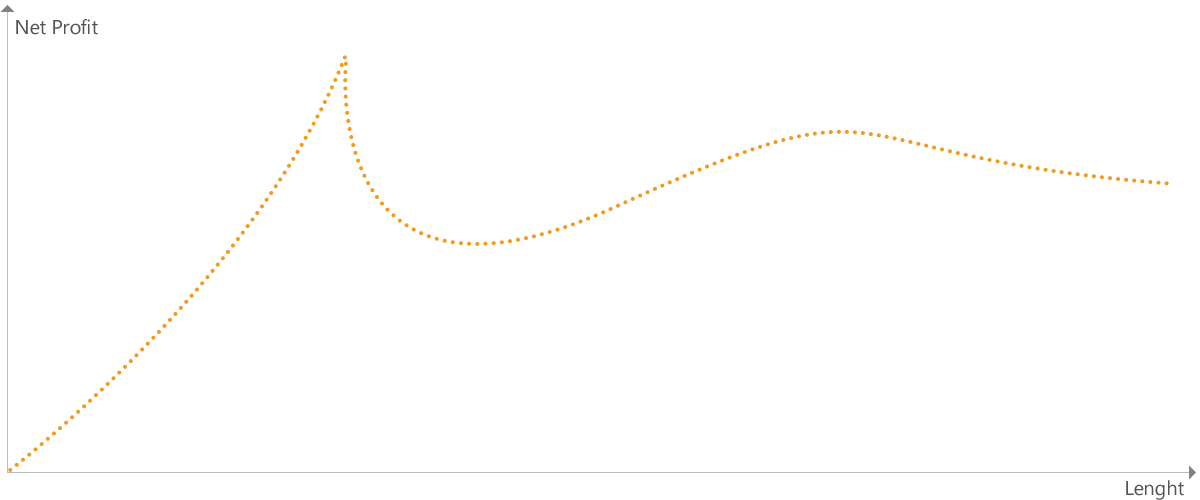
3D optimization graphs
3D optimization graphs give visual representations of how the strategy parameters affect trading performance. The 3D graph reveals most robust parameter zones, and is a great tool for avoiding over-optimization, which also known as curve-fitting. A strategy that has abrupt performance breakdowns with only small parameter changes cannot be considered robust. You can superimpose results of different optimizations onto each other to compare results, and see if the optimal inputs you found are confirmed by other tests. You can use superimposition to compare genetic and exhaustive optimization results, and you can evaluate how robust your findings are. 3D surfaces can be drawn by any criteria available in the optimization report, for example, net profit, percent profitable, and max drawdown. Relevant input and output values are displayed when the mouse cursor hovers over a particular point on the graph’s surface.
