How does auto trading work?
Orders generated by a trading strategy in MultiCharts are sent directly to the broker’s server. Then the broker responds with a message about the order status, and you can see on your chart if the trade was successful.
MultiCharts
Let it trade for you
Auto trading is very convenient, because once you have written and tested your logic—you no longer need to constantly watch the market. Also, automated trading makes trading high-frequency strategies possible. With trading systems like these, manual order entry would result in unacceptably long delays, and it would not be possible to trade them.
Plenty of trading gateways to choose from
MultiCharts supports a large number of trading gateways, and more are added in each new version. See the Supported Brokers page for complete details. If you need to do some tests before sending orders to your live account, just use pre-built Paper Trading broker profile to transmit your strategy orders, no need to request a demo account from your broker.
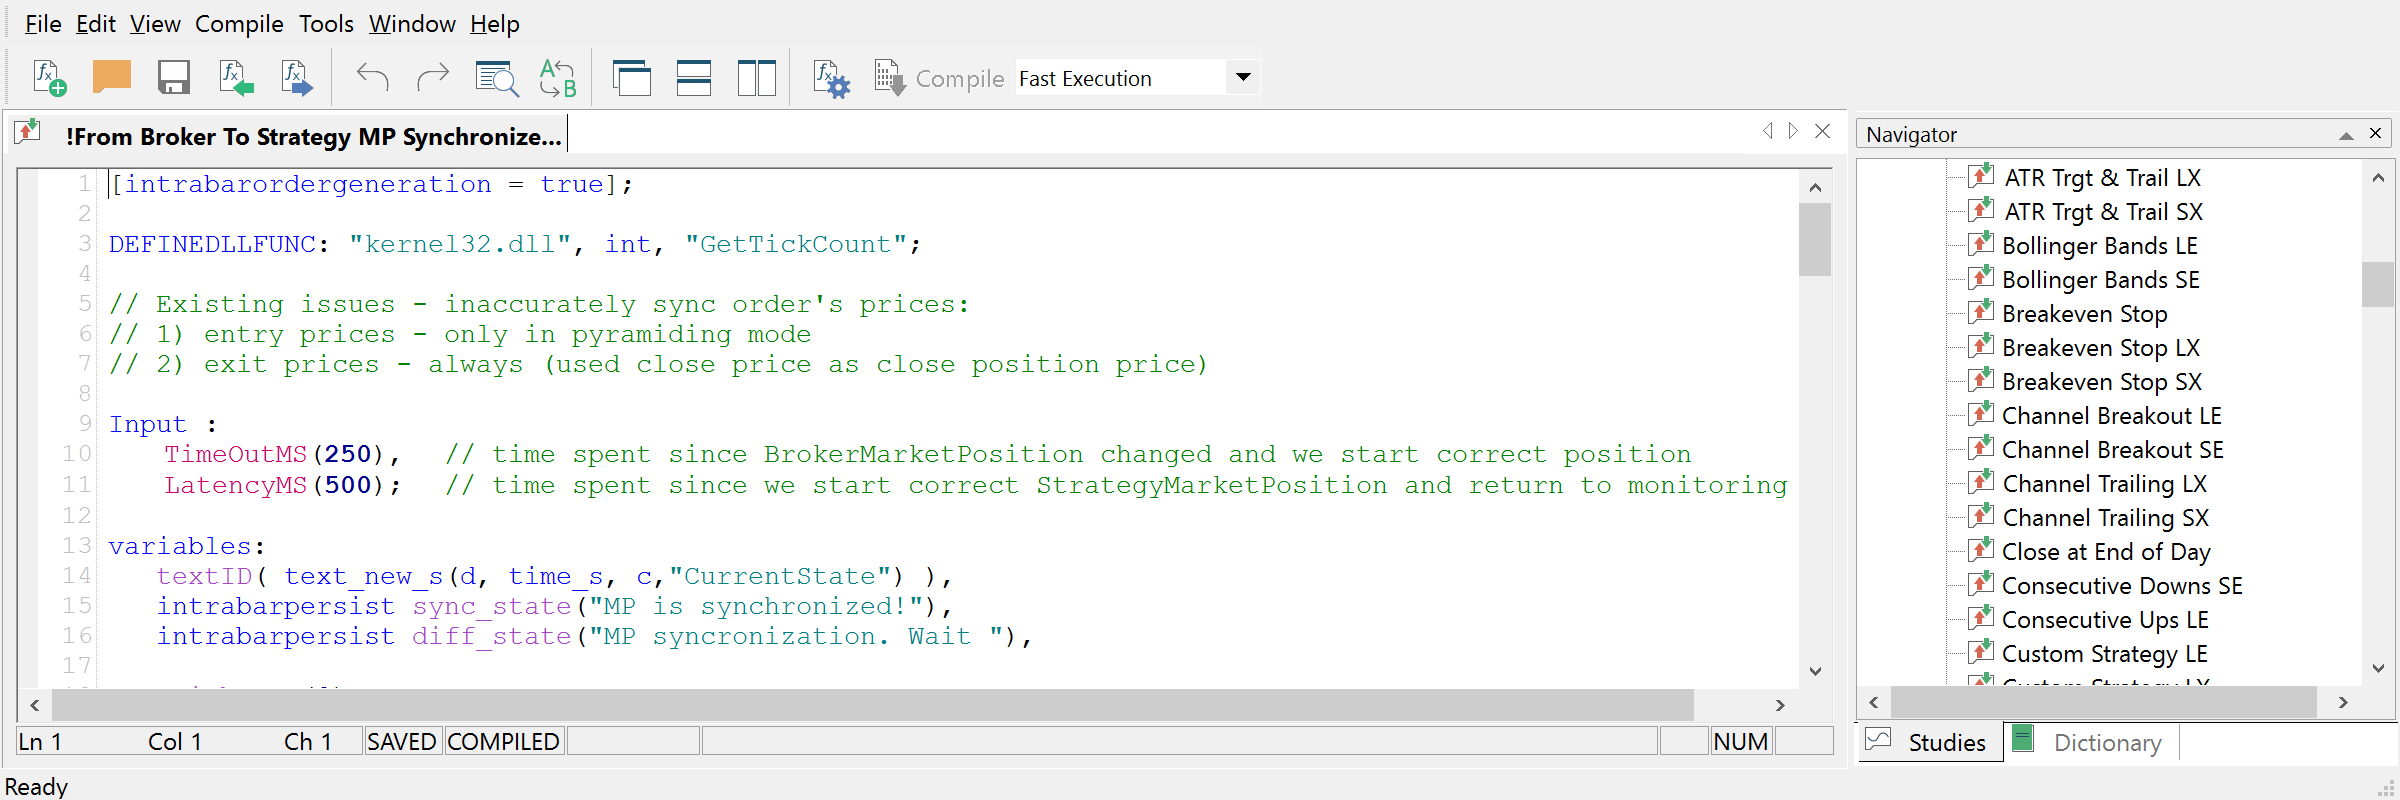
Prevent any possible asynchronization
MultiCharts provides stable auto trading that can operate without constant monitoring. Your strategy has constant access to real-time account information and it can automatically fix any possible asynchronization.
PowerLanguage Editor
Level 2 data access from strategies
Key depth of market information, also known as "level 2" data, shows the number of buyers and sellers on different price levels close to the current price. This information is very important to identify pressure on the price - i.e. if there are more sellers than buyers, the price might go down in an effort to equalize the number of players. Ten price levels are offered in each direction, and your strategy can analyze those levels in real-time to help it make trading decisions. Since a strategy can react much faster than a human being, ability to access this data from scripts presents a major advantage.
Real-time account information access
Your strategy can access all attributes of your account in real-time, including: account number, number of accounts, number of open positions, position average price, position open profit and loss (PnL), position quantity of contracts, position symbol, position total cost, real-time account equity, real-time unrealized profit, and initial capital amount. You can get more information on each category on the related Wiki page.
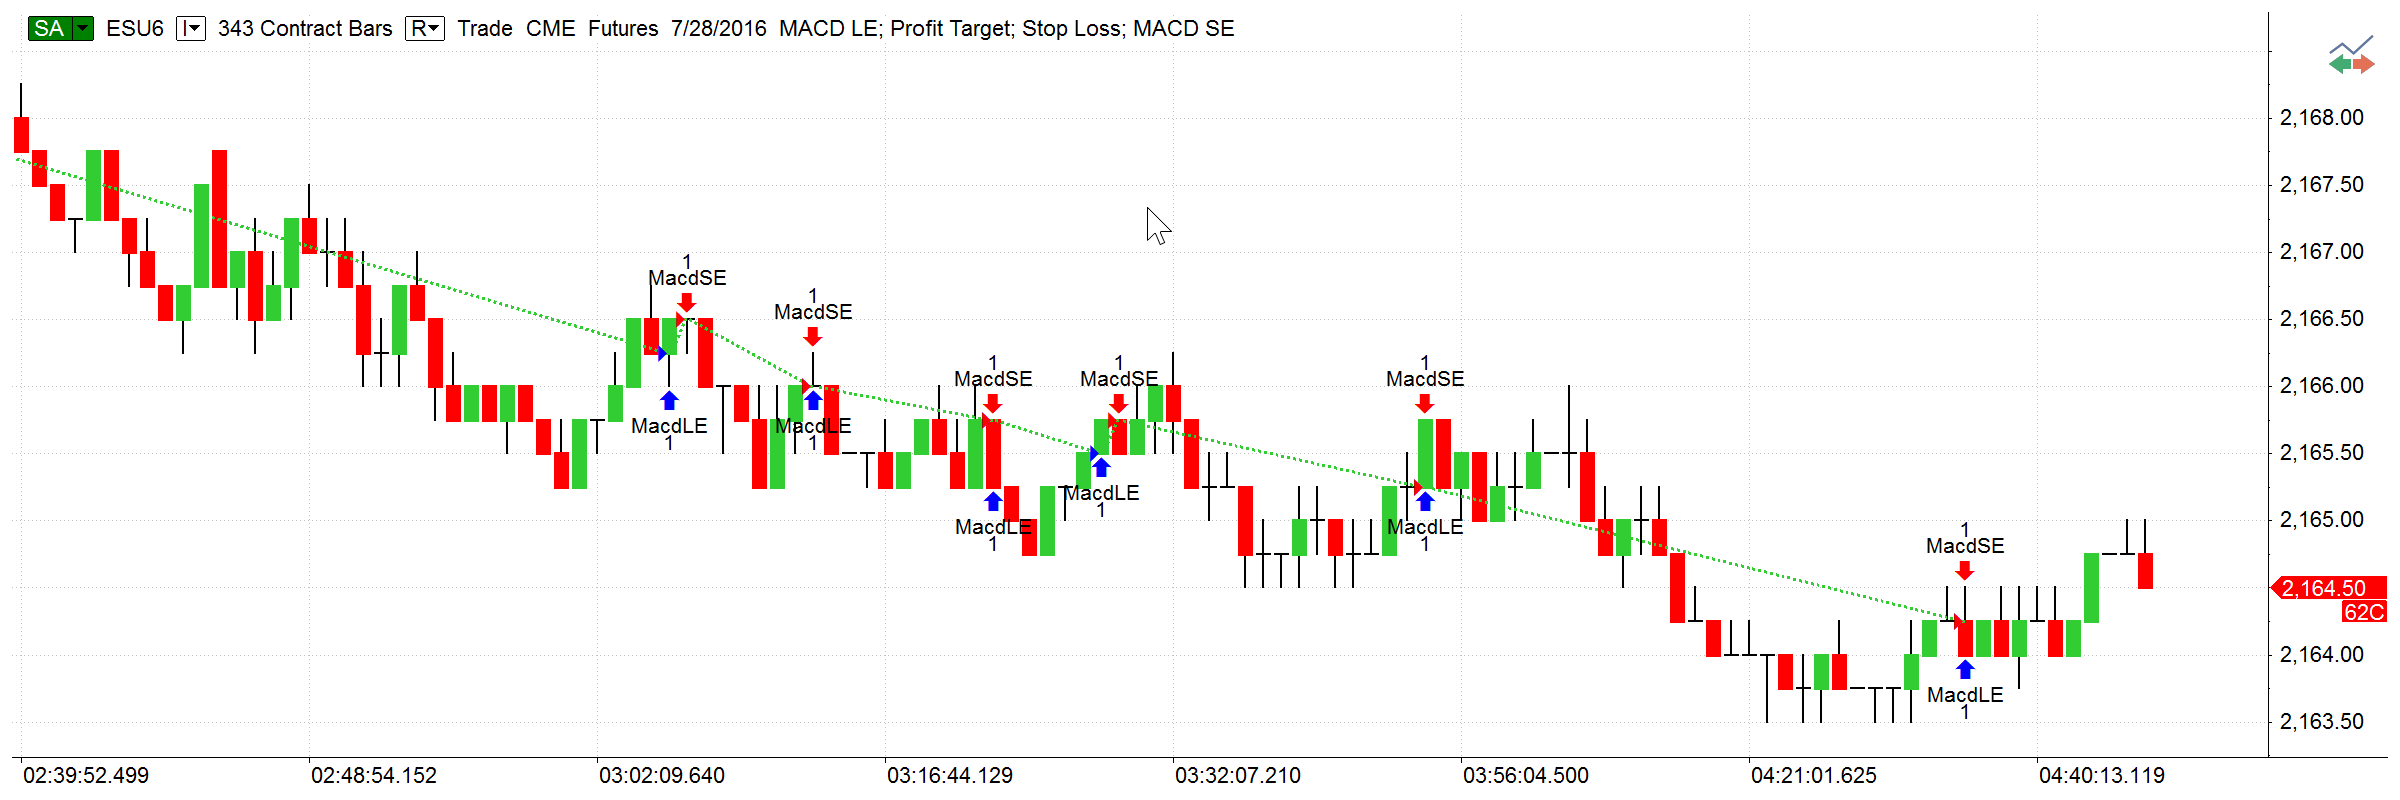
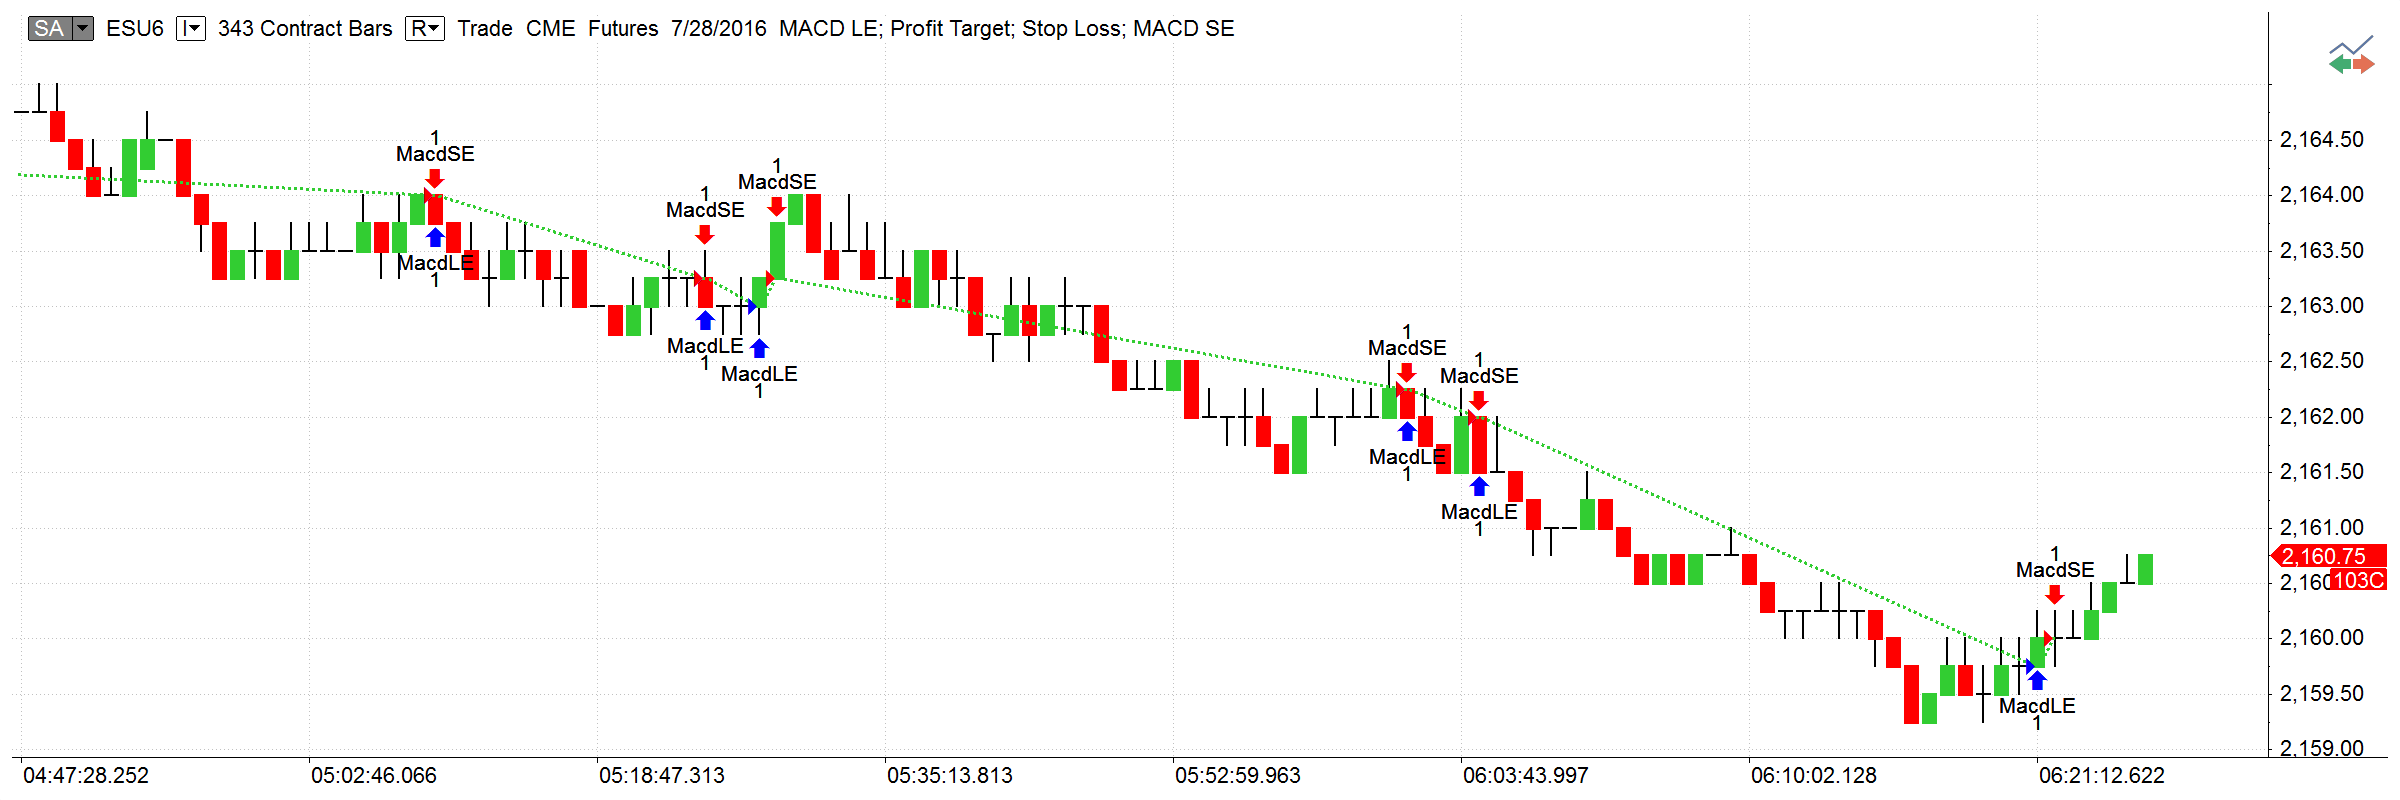
Orders that match the real world
A characteristic feature of MultiCharts’ automated trade execution is that orders are sent at the close of the previous bar—instead of being sent at the moment when they appear on the chart. This approach ensures that prices, at which the orders are actually filled, correspond closely to the prices on the chart.
MultiCharts
Support for multiple order types
In addition to market orders, MultiCharts supports limit, stop, bracket, and one-cancels-other (also known as one-cancels-all) orders. Visual and audio alerts help in monitoring order status.
Automated resending of unfilled orders
Just because limit or stop orders were sent, it doesn’t mean they were necessarily filled by the broker. Unfilled Strategy Order Replacement options can be used to keep the strategy synchronized with the actual trading position. For example, you can specify that after a certain period of time, all unexecuted limit and stop orders will be converted to market orders.
Auto trade one symbol in different ways
Auto trade the same symbol from several charts. Yes, you can do that. MultiCharts can send trading signals from several charts or even computers simultaneously. What’s more, if the same symbol is traded from several charts, the market position for each chart will be tracked separately.
Support for financial advisor accounts
Some brokers, such as Interactive Brokers, support financial advisor accounts. Having such an account makes it possible to trade multiple sub-accounts using a single main one.
Matching data and broker information
Make sure data feeds and brokers understand each other. The Symbol Mapping is crucial when your broker is not the same as your datafeed. There is no one strict standard for describing symbols, so symbol names often don’t match. You need to make sure that orders generated on a symbol get recognized by the broker. Simply open the Symbol Mapping window and make the necessary changes. The broker now will understand what you want to trade.
Start live trading in seconds
You can easily control auto trading with a switch conveniently located at the top left of your chart. Simply click it to turn auto trading on or off. If it’s green, that means you are trading live — if it’s grey, then you are in backtesting mode. Letters ‘AA’ on the switch indicate that you have asynchronous auto trading selected, and ‘SA’ mean you chose synchronous auto trading.
Choose your automated trading mode
MultiCharts has two modes for auto trading: Synchronous and Asynchronous. Each one has its advantages and drawbacks.

MultiCharts
Avoid discrepancies
The synchronous auto trading mode is a mode where entries/exits are plotted on the chart only after orders have been executed at the broker. Also, it allows to see the same open market position and active orders on the chart as at broker. The synchronous auto trading mode ensures avoiding discrepancies between the market position on the chart and the market position at the broker.
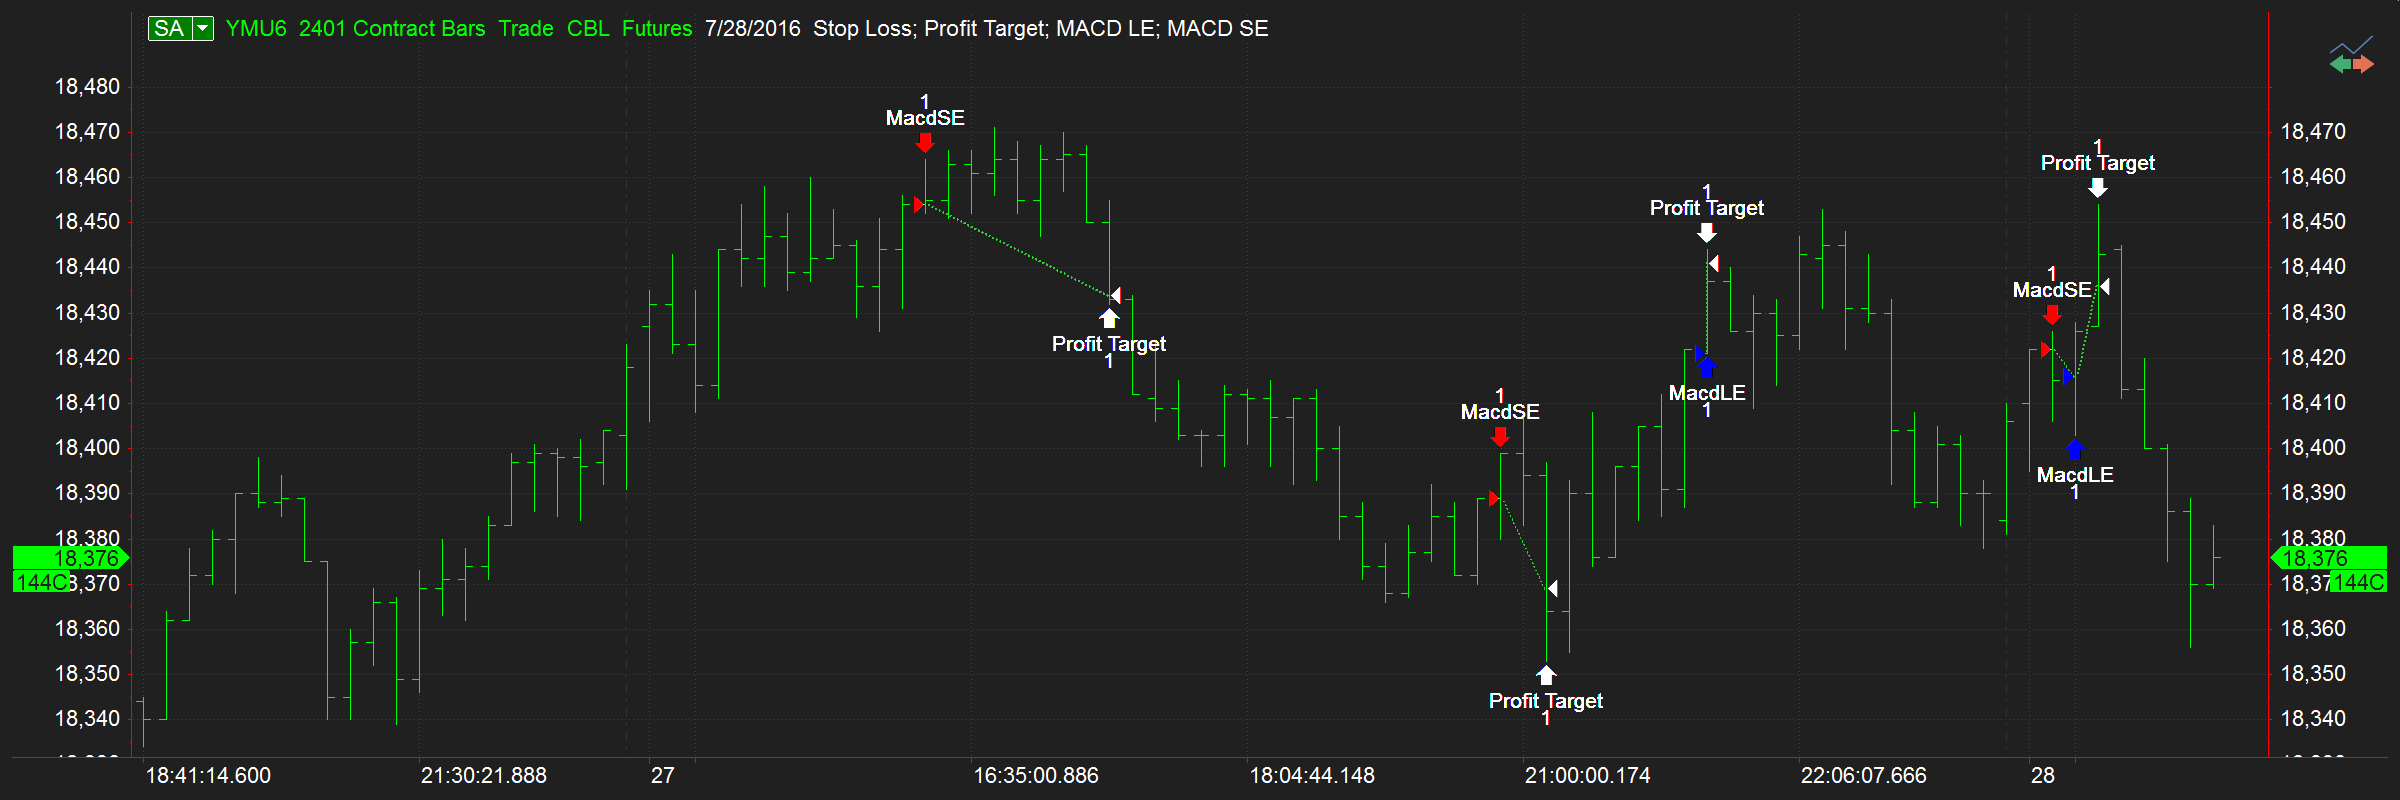
See all generated orders
The asynchronous auto trading mode is the mode where entries/exits are plotted on the chart when the price value meets the strategy conditions. However order execution by the broker is not guaranteed in case the conversion of unexecuted limit/stop entry orders is not enabled. It may cause a market position conflict between the chart and the broker. Enabling order conversion guarantees that the order will be filled at the broker, although the executed order price value could be different from the order price plotted on the chart.
Easily track your orders and strategy positions
An important feature of MultiCharts is called the Order and Position Tracker. In this separate window, you can easily view information about accounts, strategy orders and open positions, positions history and trade summary.
MultiCharts
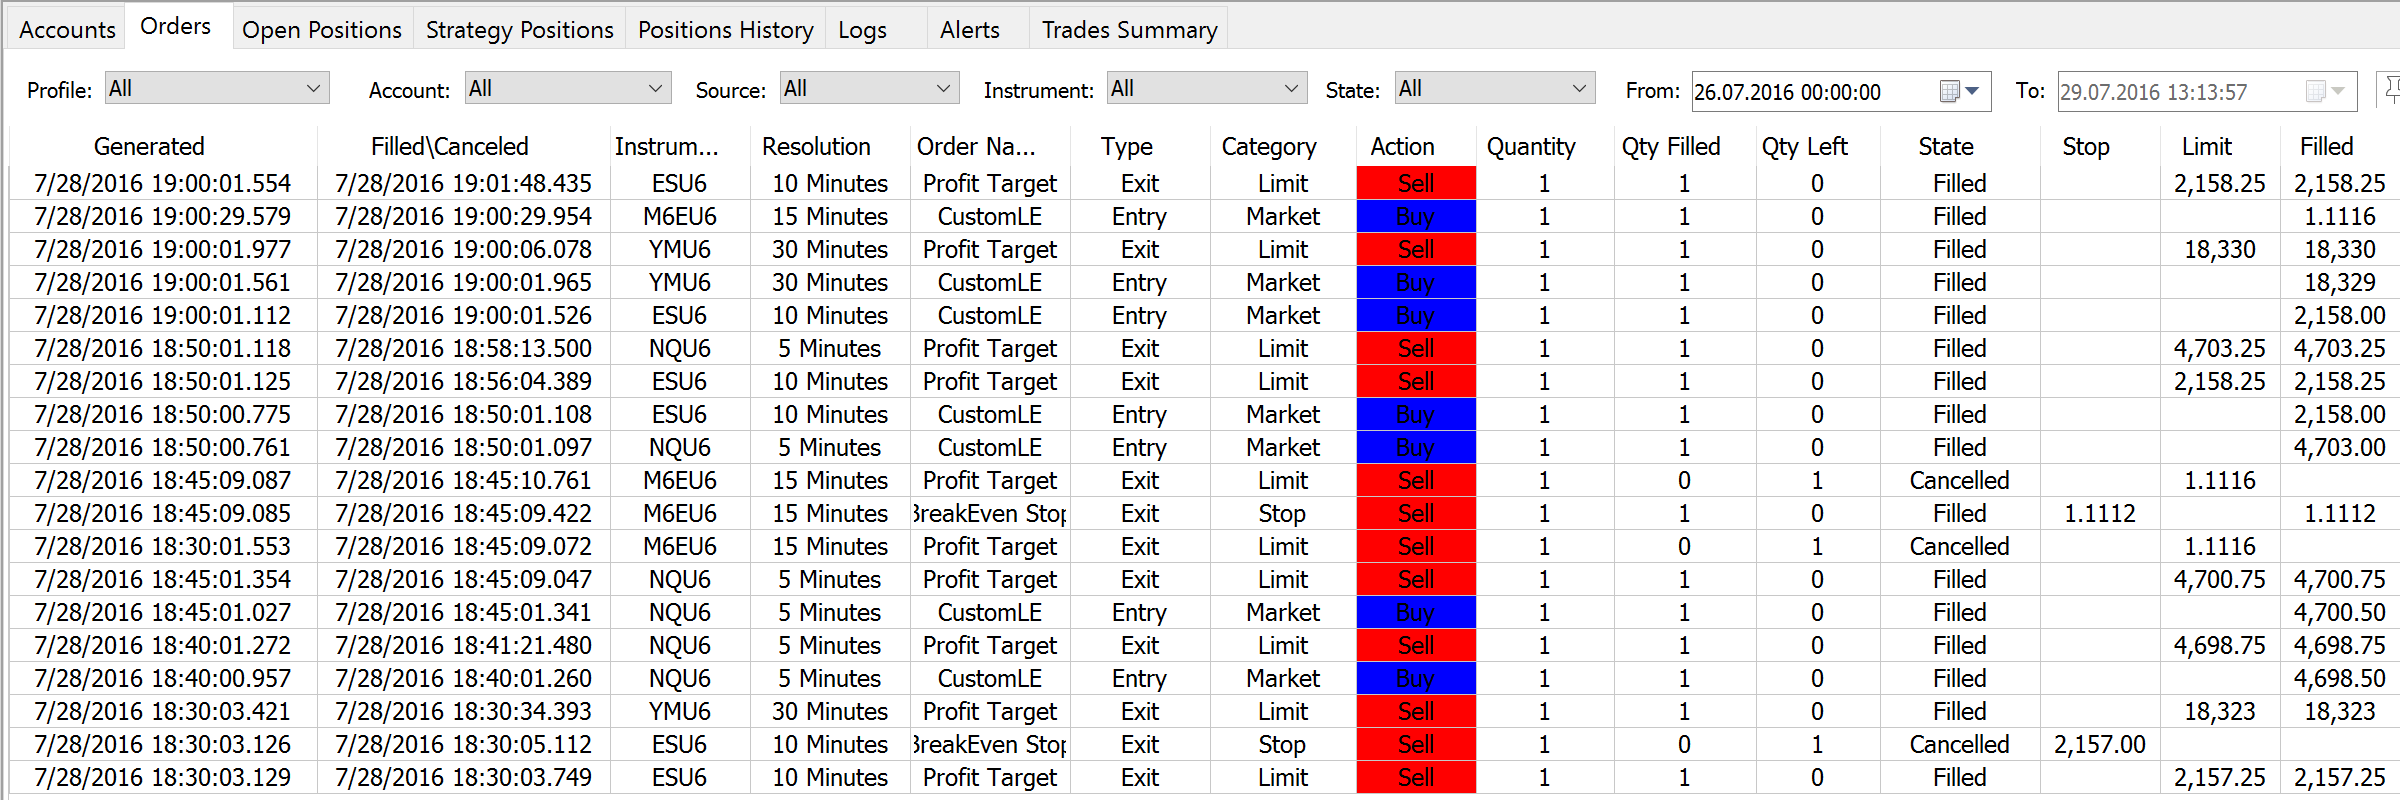
Order status fields
There are many fields that provide important information about orders, such as Filled/Cancelled status, Instrument name, Resolution, Order Name, Category, Quantity, Broker, Strategy Name and Workspace. Many important fields about strategy positions are also available, such as Strategy Position, Broker Position, Positions Match, Strategy P/L, Open P/L, Broker and Strategy Name.
Find the information you need
Many convenient filters give you the ability to find the information you need – quickly and easily. The Log tab gives the ability to see technical messages from the broker and from MultiCharts. Also, you can get the data for further analysis from Positions History tab of using Trades Summary functionality.
Email, visual and audio alerts
Strategies can alert you in a variety of ways when they generate an order - through showing an alert on your screen, playing a sounds, and even sending an email. Email is probably one of the most versatile alert methods because it can be received by almost any modern device. Some providers (i.e. Verizon) also offer a way to send an email to a phone number, whereby they convert it to a text message
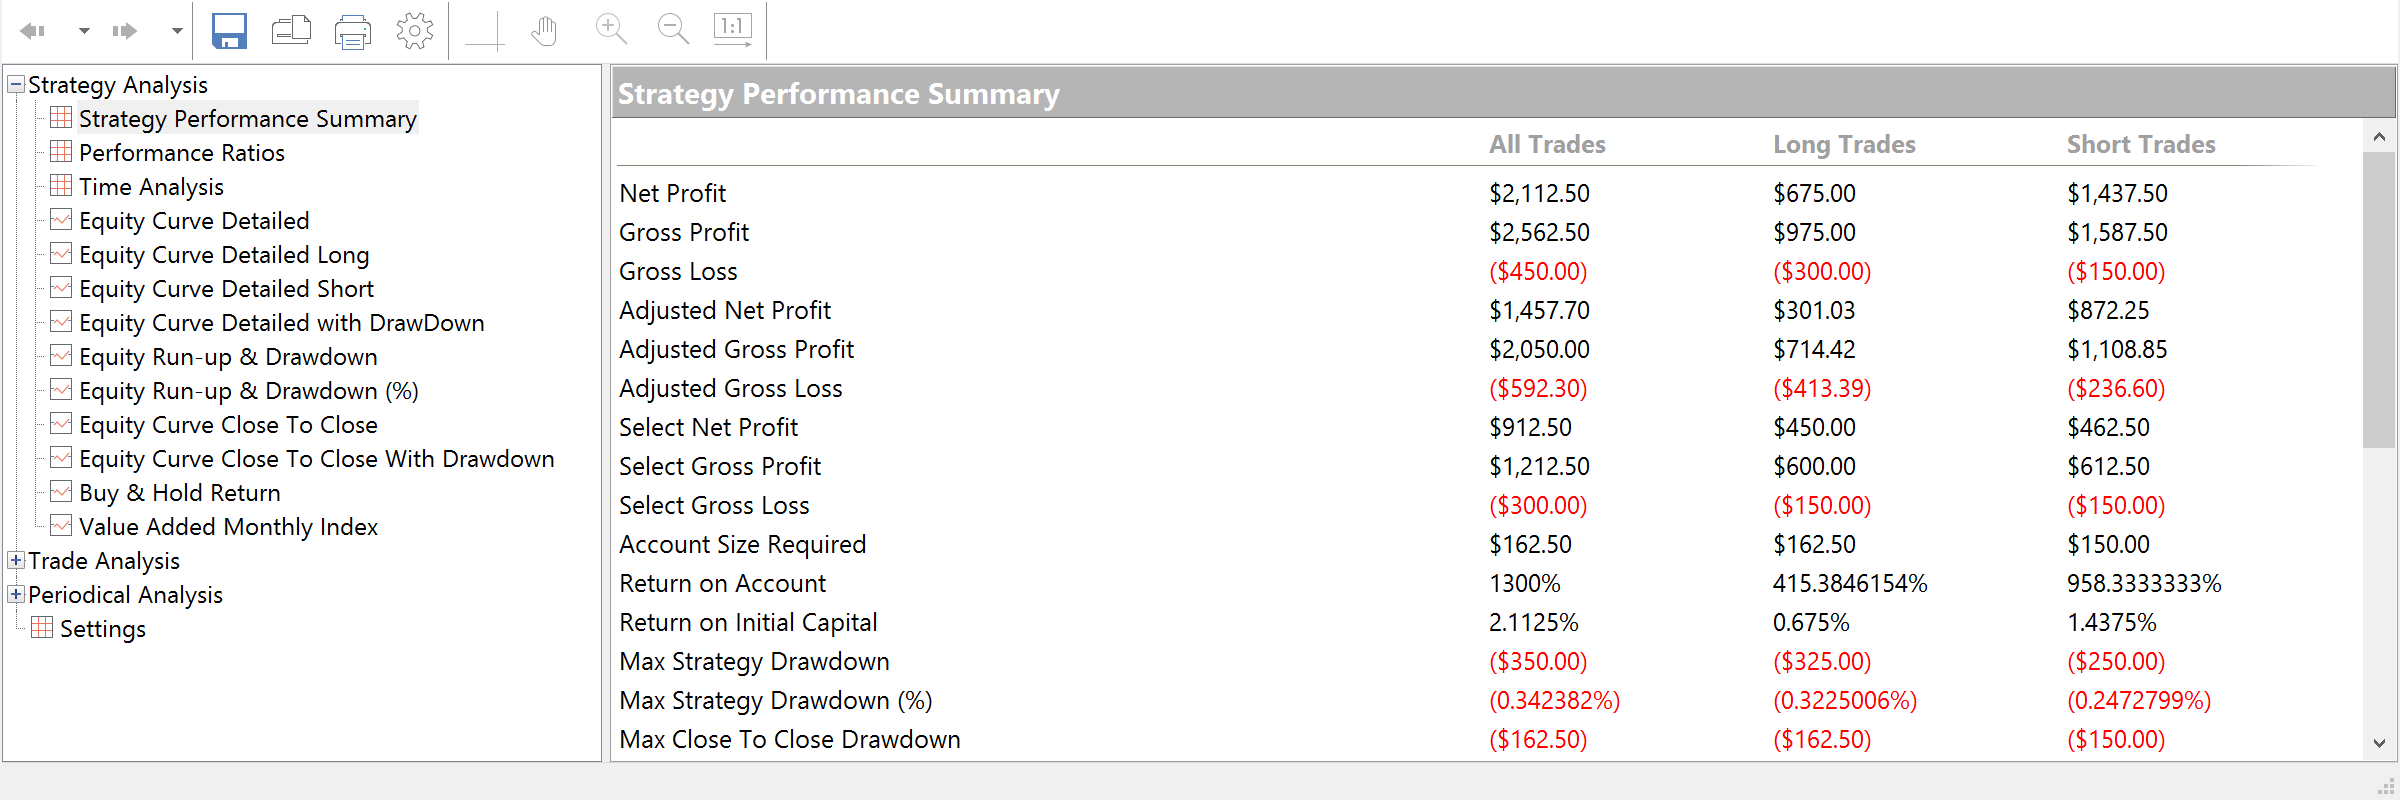
Trading Performance Report
When traders want to get the full statistics on auto trading they open Trading Performance Report. Basing on the trades placed in the chart the performance report can be calculated to comprehensively analyze the strategy performance measures as well as trades list and statistics. There are over 100 performance indices available for analysis including about 30 charts. Learn more about reports in MultiCharts please visit our Wiki page.
Trading Performance Report