
The Multicharts developers did an amazing job creating Renko bars that are testable. We have the real open, break on session, and the wick. Thank you!
Is there any development in action to create a testable Point and Figure chart? The real open and real close would be awesome and fairly simple for the developers, but if we could get a wick in there as well, that'd be really impressive! For me, the Real Open and Real Close would be good enough.
As they are now, no one can use them without some significant programming. We need separate strategies to test vs to trade because the half the boxes on the screen are not from real data, but for what seems like simple visual appearances.
Point and Figure charting
-
Andrew MultiCharts

- Posts: 1587
- Joined: 11 Oct 2011
- Has thanked: 931 times
- Been thanked: 559 times
Re: Point and Figure charting
I've been studying MC's native Point and Figure charting capabilities for the last week. I've found a few issues that should be looked at.
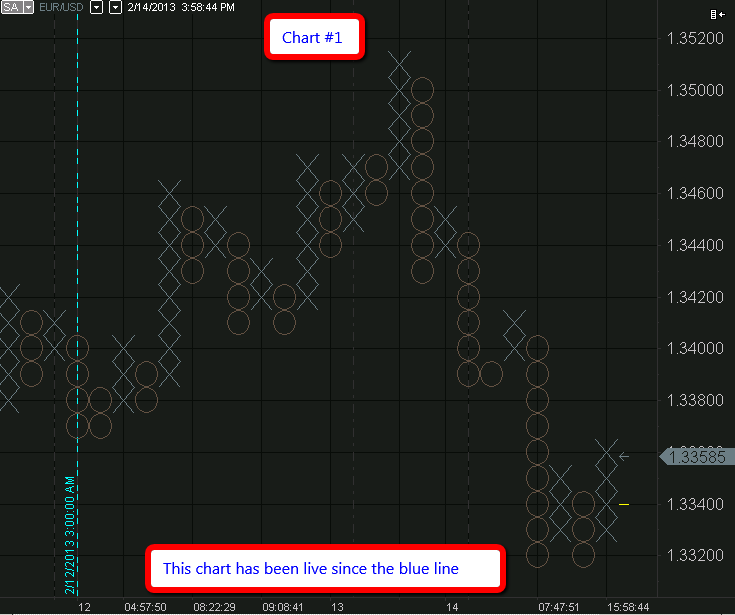
In my examples I'm using 10pip/2 intervals/Close P&F settings.
After a large move in either direction, the boxes develop a bug:
Chart #1 has been running since my blue vertical line:
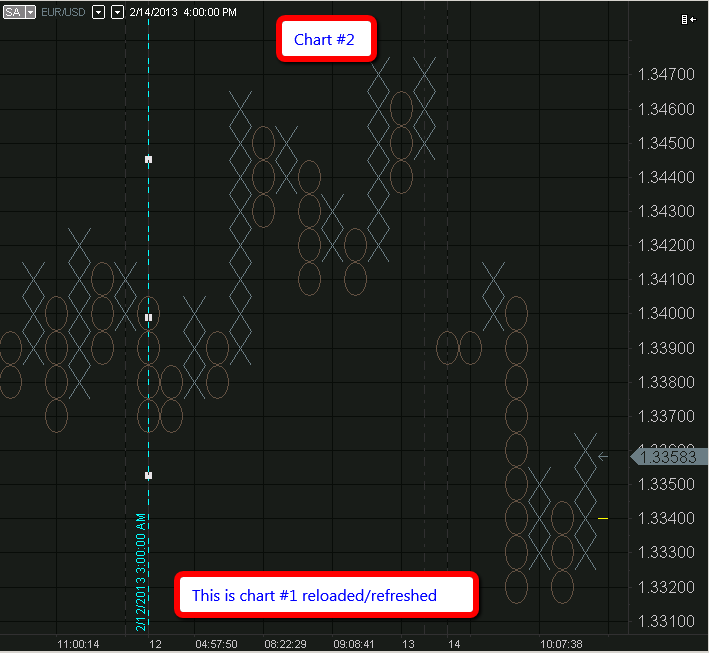
I refreshed Chart #1 and received this gap with a significant price difference:
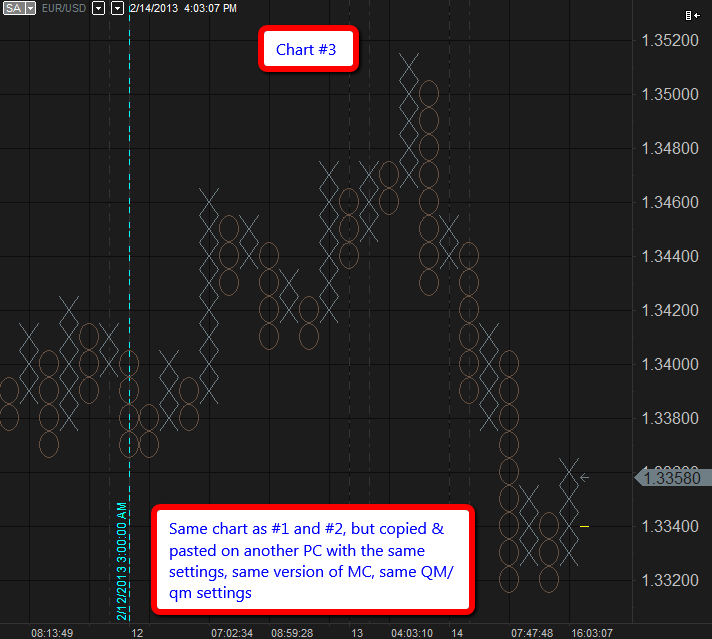
Here is the same chart copied and pasted to my other computer with every setting exactly the same:
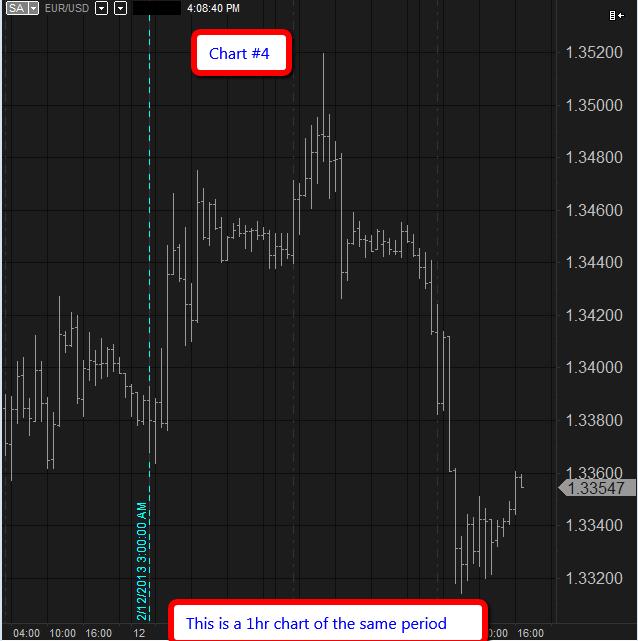
Actual data example:
This issue has showed up 2 times for me. Both times have been right after a session break with a significant move in the market.
In my examples I'm using 10pip/2 intervals/Close P&F settings.
After a large move in either direction, the boxes develop a bug:
Chart #1 has been running since my blue vertical line:
I refreshed Chart #1 and received this gap with a significant price difference:
Here is the same chart copied and pasted to my other computer with every setting exactly the same:
Actual data example:
This issue has showed up 2 times for me. Both times have been right after a session break with a significant move in the market.
- Attachments
-
- chart4.png
- (32.21 KiB) Downloaded 1699 times
-
- chart3.png
- (47.27 KiB) Downloaded 1664 times
-
- chart2.png
- (36.48 KiB) Downloaded 1662 times
-
- Chart1.png
- (35.95 KiB) Downloaded 1680 times
Re: Point and Figure charting
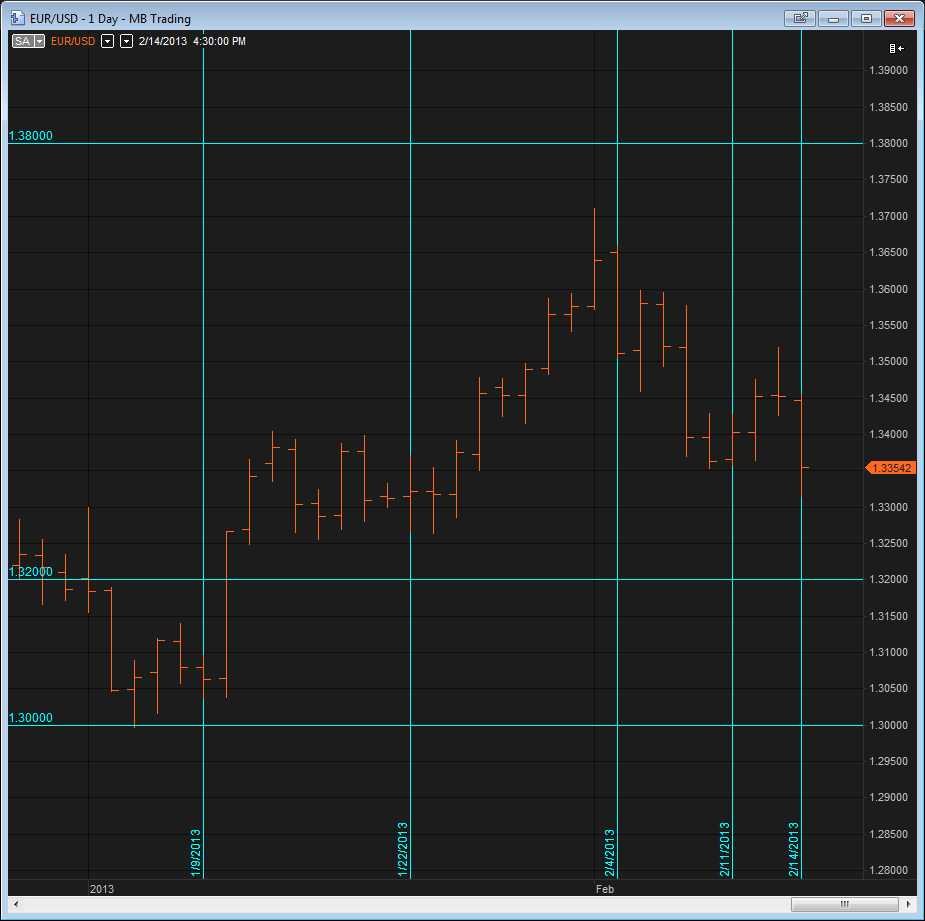
Here's another example. Sorry for the drastic 200pip P&F chart, but I figured it would be easier to see.
The Close of each box is the center of a P&F X or O. An X or an O is painted once the price crosses the center. However.. there are several Xs and Os that are painted (on smaller charts too) that have no actual price behind them... or even close:
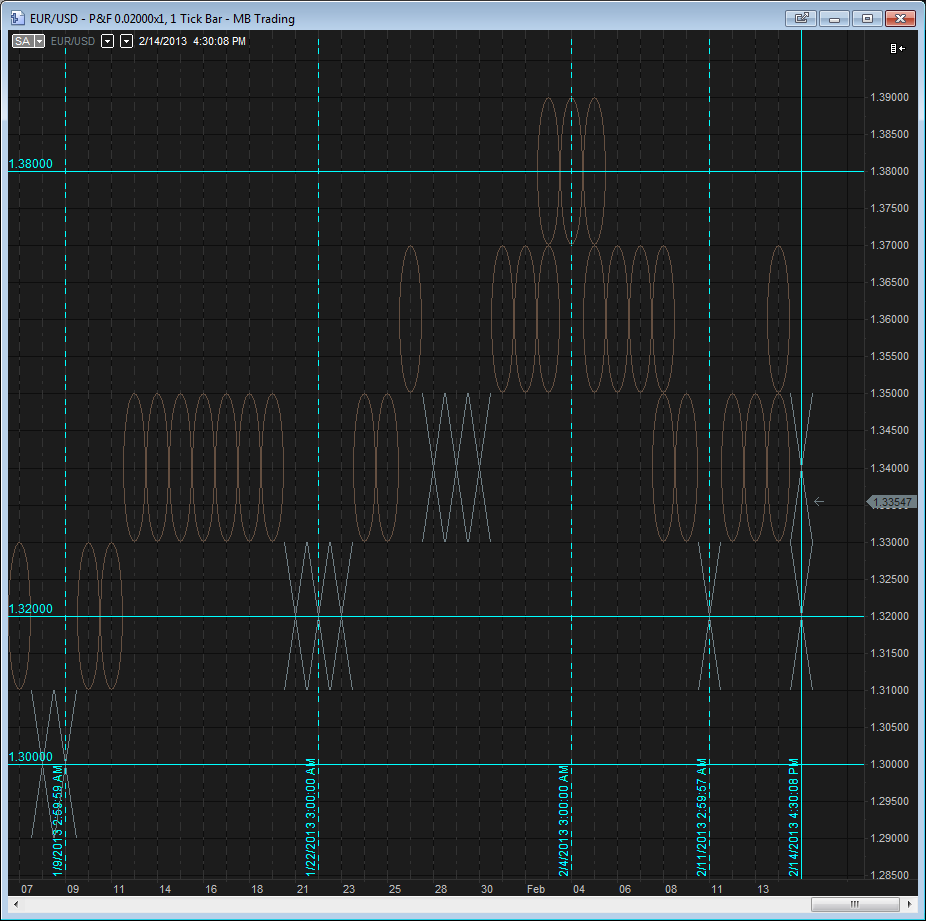
Compared to:
The Close of each box is the center of a P&F X or O. An X or an O is painted once the price crosses the center. However.. there are several Xs and Os that are painted (on smaller charts too) that have no actual price behind them... or even close:
Compared to:
- Attachments
-
- Daily.png
- (46.86 KiB) Downloaded 1697 times
-
- 200pip_P&F.png
- (61.86 KiB) Downloaded 1655 times
-
Andrew MultiCharts
- Posts: 1587
- Joined: 11 Oct 2011
- Has thanked: 931 times
- Been thanked: 559 times
Re: Point and Figure charting
Please go to Help -> About MultiCharts and tell me what is the exact build number of your MC copy.
We will need this workspace + exported symbols from QuoteManager with data. Please send the files and version to my email (ashuvlenov@multicharts.com).
We will need this workspace + exported symbols from QuoteManager with data. Please send the files and version to my email (ashuvlenov@multicharts.com).
Re: Point and Figure charting
Andrew,
MultiCharts64 Version 8.5 Release Candidate (Build 6662)
Attempt to load a chart with the settings I've shown. The issues and settings are clearly stated above.
*The gap and distortion bug won't be able to be replicated until another significant move comes at a session break... Another user has posted this in the recent past.
-
Andrew MultiCharts
- Posts: 1587
- Joined: 11 Oct 2011
- Has thanked: 931 times
- Been thanked: 559 times
Re: Point and Figure charting
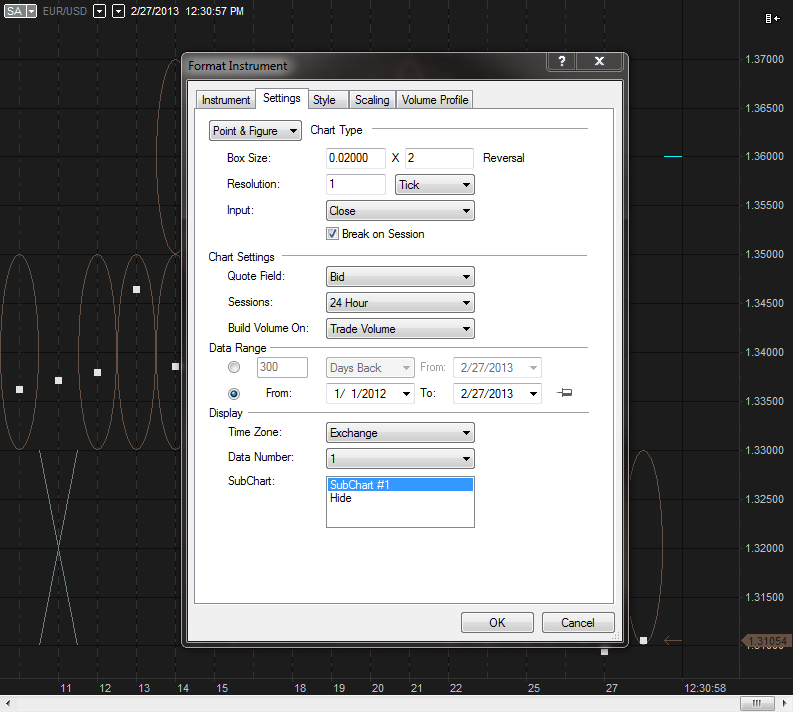
Please make the screenshot of the Format Instruments window -> Settings tab of the Point and Figure chart. I will also need the screenshot of your session hours applied to this chart.
Re: Point and Figure charting
I've recently gotten onto 3 other computers with completely different settings and symbols. All have the same bug of calculating incorrect price increments when price hasn't been reached. I'm using the 200 pip box because of how obvious the issue is. Regardless which computer I'm on, which copy of MC I'm using (currently the 8.5 release), or which session I'm running the issue is still there. To make it simple for you, I've loaded it up on a native 24/hr session. Have you tried loading it up on a chart?
- Attachments
-
- 2013-02-27_0931.png
- (70.44 KiB) Downloaded 1695 times
-
Andrew MultiCharts
- Posts: 1587
- Joined: 11 Oct 2011
- Has thanked: 931 times
- Been thanked: 559 times
Re: Point and Figure charting
MAtricks, please provide us with the following files if you are interested in us studying the issue:
- Screenshot(s) demonstrating the issue on a particular workspace, where we can see date, time of the problematic bars (please highlight the problematic bars).
- The workspace, demonstrated on the screenshot.
- The symbol that is plotted on this workspace, exported from QuoteManager as .qmd archive with data.
Re: Point and Figure charting
Produce the chart. You will see this issue regardless of the symbol and the symbol settings.
I saw a bug and pointed it out. Now I believe it's Multicharts' obligation to work on it. I apologize but this back and forth is frustrating when the bug is so obvious.
I saw a bug and pointed it out. Now I believe it's Multicharts' obligation to work on it. I apologize but this back and forth is frustrating when the bug is so obvious.
Last edited by MAtricks on 28 Feb 2013, edited 1 time in total.
-
Andrew MultiCharts
- Posts: 1587
- Joined: 11 Oct 2011
- Has thanked: 931 times
- Been thanked: 559 times
Re: Point and Figure charting
MAtricks, let me explain something. The information you provided is not enough. The workspace and the exported symbols in .qmd archive have all the settings we need to study the issue. If you are not willing to give us the requested files, the following screenshots would be enough:
- Screenshot(s) demonstrating the issue on a particular workspace, where we can see date, time of the problematic bars (please highlight the problematic bars).
- Screenshot of Format Instrument window (MultiCharts), Instrument tab of the chart from this workspace.
- Screenshot of Format Instrument window (MultiCharts), Settings tab of the chart from this workspace.
- Screenshot of Edit Symbol window (QuoteManager), Forex tab of the symbol plotted on this workspace.
- Screenshot of Edit Symbol window (QuoteManager), Settings tab of the symbol plotted on this workspace. If "Use Exchange & ECN's Settings" is selected on this tab, please open Tools menu in QuoteManager, then go to Exchange & ECN's, select the specified exchange, and click on Edit... - we will need screenshots of both tabs: General and Time Zone.
- Screenshot of Edit Symbol window, Sessions tab of the symbol plotted on this workspace. If "Use Exchange & ECN's Settings" is selected on this tab and you did not do this in the previous point, please open Tools menu in QuoteManager, then go to Exchange & ECN's, select the specified exchange, and click on Edit... - we will need screenshots of both tabs: General and Time Zone.
Re: Point and Figure charting
Again I apologize, but I believe I'm being misunderstood.Produce the chart. You will see this issue regardless of the symbol and the symbol settings.
Steps to take to reveal this bug for yourself:
1. Open window
2. Pick any symbol from any quote feed with any session setting you'd like
3. Select Point and Figure charting with a box size of 200 points/pips
4. Compare price (center of Xs and Os) to a daily chart
5. Bug is revealed
The 1st issue I posted (gapping) is beyond me. I'm only talking about the 2nd posted issue (incorrect boxes within large ranges).
Re: Point and Figure charting
Again, misunderstood...
As I said before, I've gotten on 3 different computers, different symbols, different users, different settings, different locations, and one is even in another state. All have the same effect. Not my issue and I don't really care... I just thought MC should know.
As I said before, I've gotten on 3 different computers, different symbols, different users, different settings, different locations, and one is even in another state. All have the same effect. Not my issue and I don't really care... I just thought MC should know.
Re: Point and Figure charting
ur collecting bid data and saving to local database, no? error is probably in your collected data, datafeed is TS? I have seen gaps in reloaded TS data as well.
Again, misunderstood...
As I said before, I've gotten on 3 different computers, different symbols, different users, different settings, different locations, and one is even in another state. All have the same effect. Not my issue and I don't really care... I just thought MC should know.
Re: Point and Figure charting
Somehow I'm not getting my point across. Let's deal with pictures because my English isn't working.
Please post a screen shot of the EURUSD from your computer. Use a Point and Figure chart with a box size of 1000pips with a Reversal of 2. Please check the box next to the Session Break option. It would be best for the window to show a year of data.
With a 1000 pip reversal, nothing should happen right? In 2012 - now, EURUSD has not touched 1.2000 nor 1.4000. This means that there should be 1.3000 boxes across the screen at every session break.
1000 pip bars are silly, but the issue happens very infrequently on small box sizes as well which is why I'm posting this.
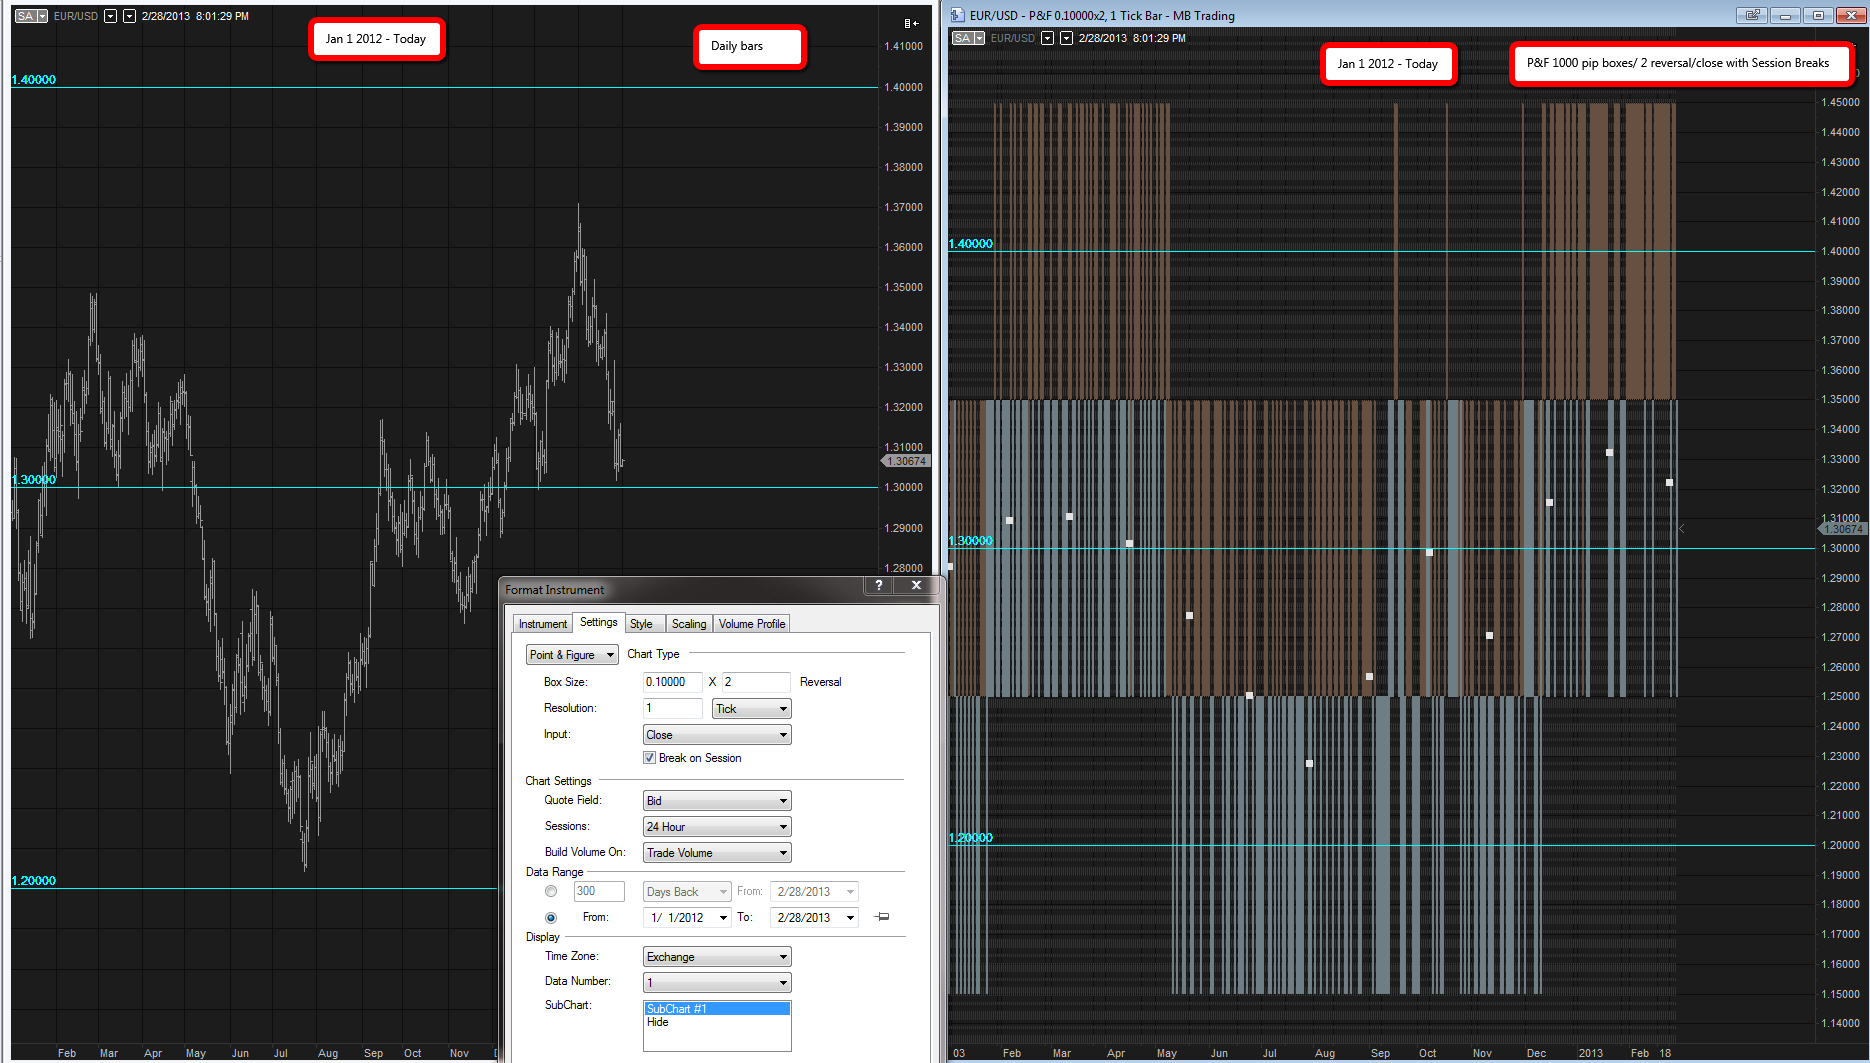
It is ridiculous to think that this is an issue with my data feed, settings, or a different copy of MC. (current 8.5 release). Load up the chart and see for yourself if the pictures don't make sense. I give up explaining... So TJ/Andrew, please post a screen shot of your own to compare with mine if this is my issue.
Please post a screen shot of the EURUSD from your computer. Use a Point and Figure chart with a box size of 1000pips with a Reversal of 2. Please check the box next to the Session Break option. It would be best for the window to show a year of data.
With a 1000 pip reversal, nothing should happen right? In 2012 - now, EURUSD has not touched 1.2000 nor 1.4000. This means that there should be 1.3000 boxes across the screen at every session break.
1000 pip bars are silly, but the issue happens very infrequently on small box sizes as well which is why I'm posting this.
It is ridiculous to think that this is an issue with my data feed, settings, or a different copy of MC. (current 8.5 release). Load up the chart and see for yourself if the pictures don't make sense. I give up explaining... So TJ/Andrew, please post a screen shot of your own to compare with mine if this is my issue.
- Attachments
-
- 2013-02-28_1701.png
- (151.12 KiB) Downloaded 1638 times
Last edited by MAtricks on 01 Mar 2013, edited 1 time in total.
-
Andrew MultiCharts
- Posts: 1587
- Joined: 11 Oct 2011
- Has thanked: 931 times
- Been thanked: 559 times
Re: Point and Figure charting
We were able to localize 1 issue, however we cannot reproduce the following behavior on our end:
Chart #1 has been running since my blue vertical line:
I refreshed Chart #1 and received this gap with a significant price difference:
Here is the same chart copied and pasted to my other computer with every setting exactly the same:
Re: Point and Figure charting
As I said, I can't reproduce it either. As soon as I restarted MC (crashed with error report that I sent in the next day), that issue removed itself. It's happened 2x with me in the last month. It's been on a session break with a significant move. That's all I have for you on that one...
Re: Point and Figure charting
Any chance that this P&F bug will get cleared up in the next version?
With a 1000 pip reversal, nothing should happen right? In 2012 - now, EURUSD has not touched 1.2000 nor 1.4000. This means that there should be 1.3000 boxes across the screen at every session break.
1000 pip bars are silly, but the issue happens very infrequently on small box sizes as well which is why I'm posting this.
-
Andrew MultiCharts
- Posts: 1587
- Joined: 11 Oct 2011
- Has thanked: 931 times
- Been thanked: 559 times
Re: Point and Figure charting
It's scheduled exactly for the coming MC 8.7 beta 2.Any chance that this P&F bug will get cleared up in the next version?