Graphing options - Stair Step
-
terrance-reiff

- Posts: 2
- Joined: 02 Dec 2013
Graphing options - Stair Step
Is there a mechanism other than via trendlines to create a stair step graph?
-
TJ

- Posts: 7742
- Joined: 29 Aug 2006
- Location: Global Citizen
- Has thanked: 1033 times
- Been thanked: 2222 times
Re: Graphing options - Stair Step
Can you elaborate a bit more on what you are trying to achieve?Is there a mechanism other than via trendlines to create a stair step graph?
You can also use PLOT to draw lines or stair step graph. Depends on the application, it might be easier, it might be harder. And vis versa with trendline drawing objects. It all depends on what you want to do.
Re: Graphing options - Stair Step
I want to join the request. I saw under the Add Ons that the Jan Arps Triple Trender has the ability to plot a volatility stop as stair step instead of a normal line and it looks way better.
How could this be done for a normal average, with trendlines or 4 plots with type bar high/low/right/left tick?

How could this be done for a normal average, with trendlines or 4 plots with type bar high/low/right/left tick?
-
arnie

- Posts: 1594
- Joined: 11 Feb 2009
- Location: Portugal
- Has thanked: 481 times
- Been thanked: 514 times
Re: Graphing options - Stair Step
Yes, a stairstep line option would be very appreciated.
One way to mimic the stairstep line is to round prices to the nearest tick
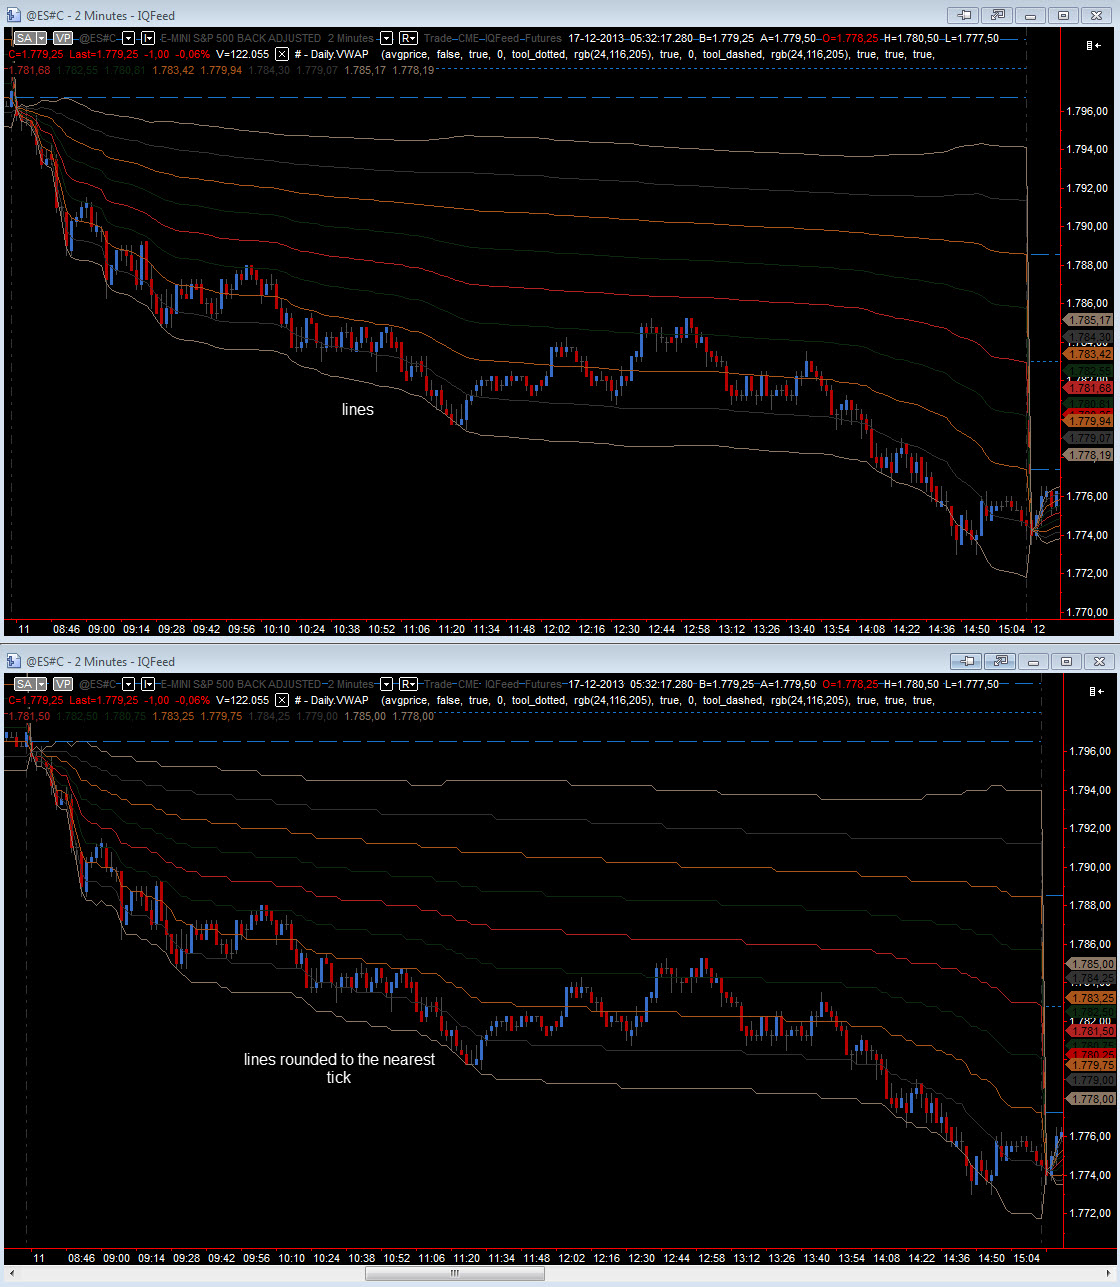
One way to mimic the stairstep line is to round prices to the nearest tick
- Attachments
-
- stairstep.jpg
- (391.16 KiB) Downloaded 1299 times
Re: Graphing options - Stair Step
The problem with left/right tick as plot is that it does not adjust for bar space between the bars. If i use this code
it looks ok with small bar spacing, but fails on larger bar spacing.
it looks ok with small bar spacing, but fails on larger bar spacing.
Code: Select all
inputs:  Price( Close ), Length( 9 ), BarSize( 3 ) , MAColor (white) ;

variables:  var0( 0 ) ;


var0 = AverageFC( Price, Length ) ;

// Plot as Bar High and Bar Low

Plot1 ( var0 	  , "BarH",MAColor ,MAColor , BarSize );

Plot2 ( var0[1] , "BarL",MAColor ,MAColor , BarSize );

//Plot as Left Tick

Plot3 ( var0[1] 	  , "BarLeft",MAColor ,MAColor , BarSize );

//Plot as Right Tick

Plot4 [1] ( var0[1] , "BarRight",MAColor ,MAColor , BarSize );
- Attachments
-
- stairstep.jpg
- (447.75 KiB) Downloaded 1019 times
-
arnie
- Posts: 1594
- Joined: 11 Feb 2009
- Location: Portugal
- Has thanked: 481 times
- Been thanked: 514 times
Re: Graphing options - Stair Step
Yes, that's why I ended removing the post because I saw what you were trying to do.arnie,
rounding does not help, try the code i.e. on the NQ or YM.
The only thing MC has that acts like a stair step is its developing POC option in the volume profile tool.
-
terrance-reiff
- Posts: 2
- Joined: 02 Dec 2013
Re: Graphing options - Stair Step
Thanks everyone; I guess I will try to develop a function that plots a "stair step".
-
ABC

- Posts: 718
- Joined: 16 Dec 2006
- Location: www.abctradinggroup.com
- Has thanked: 125 times
- Been thanked: 408 times
- Contact:
Re: Graphing options - Stair Step
You can do this currently with trendlines. Maybe also with a combination of two plots where one plots the vertical lines and the other the horizontal lines.
Regards,
ABC
Regards,
ABC
I want to join the request. I saw under the Add Ons that the Jan Arps Triple Trender has the ability to plot a volatility stop as stair step instead of a normal line and it looks way better.
How could this be done for a normal average, with trendlines or 4 plots with type bar high/low/right/left tick?
Re: Graphing options - Stair Step
ABC,
it works with this code, but the disadvantage is that you draw a trendline on every bar. On a chart with 5000 bars you end up with around 5000 trendlines.
Edit: I saw on Arps Website that the stair lines in the posted picture above are for another platform and the TS/MC version only plots normal lines. So this solution should be the only one.
I added a option to reduce drawing: if DrawOnlyVisible is set to true all lines outside the visible part of the chart gets deleted.
Code: Select all
inputs:  Price( Close ), Length( 9 ), BarSize( 3 ) , MAColor (white) , DrawOnlyVisible ( false );

variables:  SimpleAverage( 0 ) , Horizontal (-1);


if barstatus (1) = 2 then

begin

	SimpleAverage = AverageFC( Price, Length ) ;

	// Plot as Bar High and Bar Low

	if SimpleAverage[1]  <>0 and SimpleAverage <>0 then

	begin

		Plot1 ( SimpleAverage  [1]  , "BarH",MAColor ,MAColor , BarSize );

		Plot2 ( SimpleAverage       , "BarL",MAColor ,MAColor , BarSize );

		if DrawOnlyVisible then

		begin

			if datetime  < getappinfo ( aiLeftDispDateTime ) then tl_delete ( Horizontal );


		end;


		Horizontal = tl_new_self_bn ( barnumber[1], SimpleAverage[1], barnumber, SimpleAverage [1] );

	end;


	tl_setcolor (Horizontal , MAColor );

	tl_setsize  (Horizontal , BarSize);

end;