I'm trying to develop a volume bar chart indicator that shows the total volume of contracts traded during a bar with the up volume stacked on top of the down volume (see the attached mock-up) so you can easily see the total number of contracts traded for the bar and can get a quick visual on the split between up and down contracts.
I've set the Build Volume On = Trade Volume and can plot the Volume Up and Volume Dn indicators both on SubChart #2, but can't figure out how / if they can be stacked.
Ideas?
Volume of Contracts Traded
-
PD Quig

- Posts: 191
- Joined: 27 Apr 2010
- Location: San Jose
- Has thanked: 67 times
- Been thanked: 10 times
Volume of Contracts Traded
- Attachments
-
- volume stack indicator mock-up.png
- (12.54 KiB) Downloaded 626 times
-
TJ

- Posts: 7743
- Joined: 29 Aug 2006
- Location: Global Citizen
- Has thanked: 1033 times
- Been thanked: 2222 times
Re: Volume of Contracts Traded
Just plot the regular volume and set it to green,I'm trying to develop a volume bar chart indicator that shows the total volume of contracts traded during a bar with the up volume stacked on top of the down volume (see the attached mock-up) so you can easily see the total number of contracts traded for the bar and can get a quick visual on the split between up and down contracts.
I've set the Build Volume On = Trade Volume and can plot the Volume Up and Volume Dn indicators both on SubChart #2, but can't figure out how / if they can be stacked.
Ideas?
then overlay the down volume plot on top of it and set it to red.
-
PD Quig
- Posts: 191
- Joined: 27 Apr 2010
- Location: San Jose
- Has thanked: 67 times
- Been thanked: 10 times
Re: Volume of Contracts Traded
Thanks, TJ. I had tried that but couldn't make the scaling agree.
- Attachments
-
- 2014-03-27_1544.png
- (76.34 KiB) Downloaded 622 times

Re: Volume of Contracts Traded
.. MC doesn't let us align indicators very well. If you want to combine indicators, you need to combine the code. Also, why stack them? I'd make an up vs down.
Try this:
To make it even more interesting:
Play with it and see what you come up with.. please post back an update for the direction you take. I'm curious..
Try this:
Code: Select all
	Value1 = upticks ;

	Value2 = 0 - DownTicks ;


	plot1( Value1, "Up Vol" ) ;

	plot2( Value2, "Down Vol" ) ;
Code: Select all
Inputs:

	Threshhold( 1000 ) ;


Variables:

	Ups( 0 ),

	Dns( 0 ),

	intrabarpersist posC( false ),

	intrabarpersist negC( false ) ;


	posC = C>O ;

	negC = C<O ;


	Ups = upticks ;

	Dns = 0 - DownTicks ;


	if posC then begin

		Plot1( Ups, "UpVol" ) ;

	end else

	if negC then begin

		Plot2( Dns, "DownVol" ) ;

	end ;


	plot3( -Threshhold, "Overbought" ) ;

	plot4( Threshhold, "Oversold" ) ;
Play with it and see what you come up with.. please post back an update for the direction you take. I'm curious..
- Attachments
-
- 2014-03-27_1252.png
- (13.5 KiB) Downloaded 694 times
-
PD Quig
- Posts: 191
- Joined: 27 Apr 2010
- Location: San Jose
- Has thanked: 67 times
- Been thanked: 10 times
Re: Volume of Contracts Traded
MAtricks,
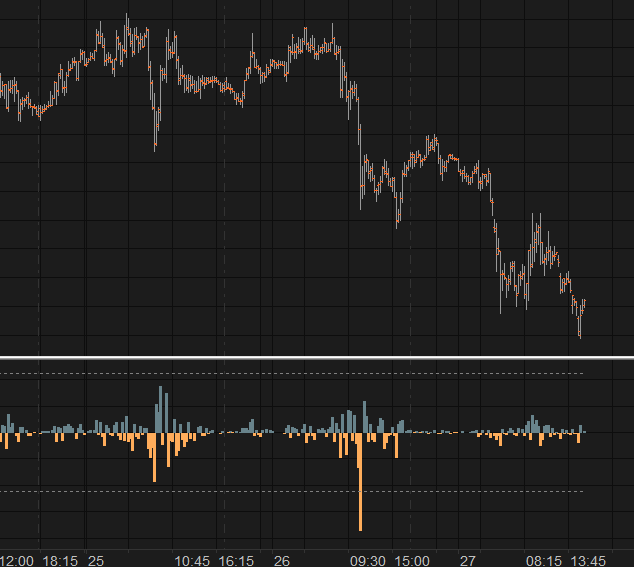
When all is said and done, I decided that the simple upticks vs. downticks approach made the most sense to me. Rather than attributing the entire volume value to either up or down, displaying both of the components of volume on the same bar are more revealing. I do like presenting the up volume above the zero line and the down volume below it rather than stacking them one atop the other. I'm thinking this method will probably require some derivative analytic to show when volume accelerates in one direction or another. Still mulling it over.
Thanks again.
PDQ
- Attachments
-
- 2014-03-31_1356.png
- (39.49 KiB) Downloaded 612 times