Hi all,
I have a simple paintbar volume indicator for chart. But in the "format Study" -> "Scaling", I can either set the scaling range by screen or fix the top and bottom scaling. Is it possible to lock the bottom scaling to zero and the top by screen?
Thanks
Jimmy
Fix Indicator's y-axis to Zero in Chart [SOLVED]
-
Henry MultiСharts

- Posts: 9165
- Joined: 25 Aug 2011
- Has thanked: 1264 times
- Been thanked: 2957 times
Re: Fix Indicator's y-axis to Zero in Chart
Hello Jimmy,
That is not possible to mix the scaling options this way. Please attach a full sized screenshot of your chart and we will try to help you out.
That is not possible to mix the scaling options this way. Please attach a full sized screenshot of your chart and we will try to help you out.
Re: Fix Indicator's y-axis to Zero in Chart [SOLVED]
Hi Henry,
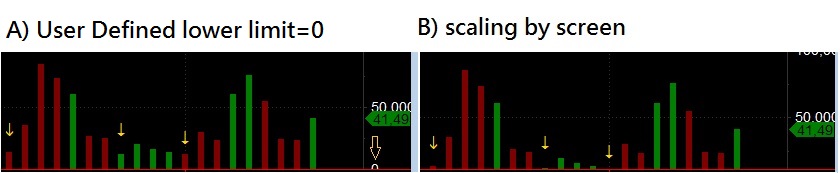
You can see the visual difference is significant when the y-axis starts at zero (A) and by screen (B).
This morning I suddenly got a workaround: plot a zero value in chart and set the scaling by "screen". It seems working. If you get a better idea, please let me know.
Attached below the "volume by color" code I use:
Code: Select all
Variables: VolBarColor(0);


If Close > Close[1] then VolBarColor = darkgreen;

If Close < Close[1] then VolBarColor = darkred;

If Close = Close[1] then VolBarColor = darkgray;


Plot1(Volume, "Volume", VolBarColor);

SetPlotWidth(1, 6);

Plot2(0,"BaseLine",Red);- Attachments
-
- MC scaling.jpg
- (40.52 KiB) Downloaded 432 times