Hello,
I need some understanding on how Kase bars are built when based on a resolution different then 1 tick, let's say for instance Kase bars of 30 points range / 400 ticks on CFD LMAX Germany30.
I run several realtime tests to compare backtest and actual execution with automated MKT orders (on close, IOG off), and the whole thing does not make much sense. I get "random" discrepencies of several points and time lag up to 2mn (difference in timestamps), way beyond usual slippage due to spread and order sending.
I also tried to build my own Kase bar indicator to better understand / verify their construction, but failed to replicate exact MC bars in this situation.
Questions (In the situation where resolution > 1 tick):
1/ Is the kase bar close price supposed to match realtime price ? If not, why exactly ?
2/ I noticed some bars having a lower range than the range setting. Why do they exist ?
3/ I noticed that bar close do not necesserally match the high or the low, but could be anywhere within the bar range. Is it expected for a Kase bar ?
4/ Is it expected that when changing the starting date of such chart, bars are rebuilt differently ?
Basically I need to evaluate the accuracy of a backtest based on such bars construction (with resolution > 1 tick),.
Thanks for your help !
Kase bar resolution [SOLVED]
-
Svetlana MultiCharts

- Posts: 645
- Joined: 19 Oct 2017
- Has thanked: 3 times
- Been thanked: 163 times
Re: Kase bar resolution
Hello, Mydesign,
The standard algorithm of Kase Bar is the following.
At first the true range is calculated. It is the highest value between Close[1] - Low; Close[1] - High; High - Low;
Kase Bar open and close conditions depend on the true range value. If a true range value of the base data series exceeds the Box Size, specified in the Kase Bar chart settings, a new bar is opened. If the true range does not exceed the Box Size, then the bars are plotted without changes.
This chat type is typically used to smoothen the spikes on a chaotic market. Kase Bars smooth out the bar size and automatically adapt to volatility changes. If the market is calm and does not go beyond the established true range, the bars do not change.
You can refer to this indicator plotting Kase Bar Open for approximate demonstration of the algorithm in PowerLanguage (it may be helpful though it is not identical to the Kase Bar algorithm).
Let us return to your questions.
To avoid this behavior one can use “Break on session” option to tie the initial point (first bar) to the beginning of the session.
The standard algorithm of Kase Bar is the following.
At first the true range is calculated. It is the highest value between Close[1] - Low; Close[1] - High; High - Low;
Kase Bar open and close conditions depend on the true range value. If a true range value of the base data series exceeds the Box Size, specified in the Kase Bar chart settings, a new bar is opened. If the true range does not exceed the Box Size, then the bars are plotted without changes.
This chat type is typically used to smoothen the spikes on a chaotic market. Kase Bars smooth out the bar size and automatically adapt to volatility changes. If the market is calm and does not go beyond the established true range, the bars do not change.
You can refer to this indicator plotting Kase Bar Open for approximate demonstration of the algorithm in PowerLanguage (it may be helpful though it is not identical to the Kase Bar algorithm).
Code: Select all
Input: TR(0.0003);

var: intrabarpersist HL(0);
Var: intrabarpersist TrueHC(0);
Var: intrabarpersist TrueLC(0);

Var: N0(0);

once TrueHC = high;
once TrueLC = low;

once cleardebug;


if TrueHC <= high then begin
	TrueHC = high;
end;
if TrueLC >= low then begin
	TrueLC = low;
end;


HL = absvalue(TrueHC - TrueLC);

if HL > TR then
begin
	TrueHC = open;
	TrueLC = open;
	plot13(Open);
end;

//plot14(TrueHC);
//plot15(TrueLC);Yes, it is.1/ Is the kase bar close price supposed to match realtime price ? If not, why exactly ?
Because the true range formula includes not only the bar height (H – L), but the highest value between "Close[1] - Low, Close[1] - High, High - Low". If the true range does not exceed the box size, the bar shall not be changed.2/ I noticed some bars having a lower range than the range setting. Why do they exist ?
Yes, it is.3/ I noticed that bar close do not necesserally match the high or the low, but could be anywhere within the bar range. Is it expected for a Kase bar ?
Yes, it is expected, as the true range "Close[1] - Low, Close[1] - High" value depends on the previous bar. Consequently Kase Bar depends on previous values. That’s why the initial point affects on bar formation of the whole data series.4/ Is it expected that when changing the starting date of such chart, bars are rebuilt differently?
To avoid this behavior one can use “Break on session” option to tie the initial point (first bar) to the beginning of the session.
Re: Kase bar resolution
Thanks a lot Svetlana for your helpful answers,
Yet, you might have missed part of my point. I was not referering to kase bar construction per se, which is well understood in the case we use a tick by tick resolution. My questions were addressed in the very specific context where we apply them on a resolution larger than 1 tick, for instance 600 ticks.
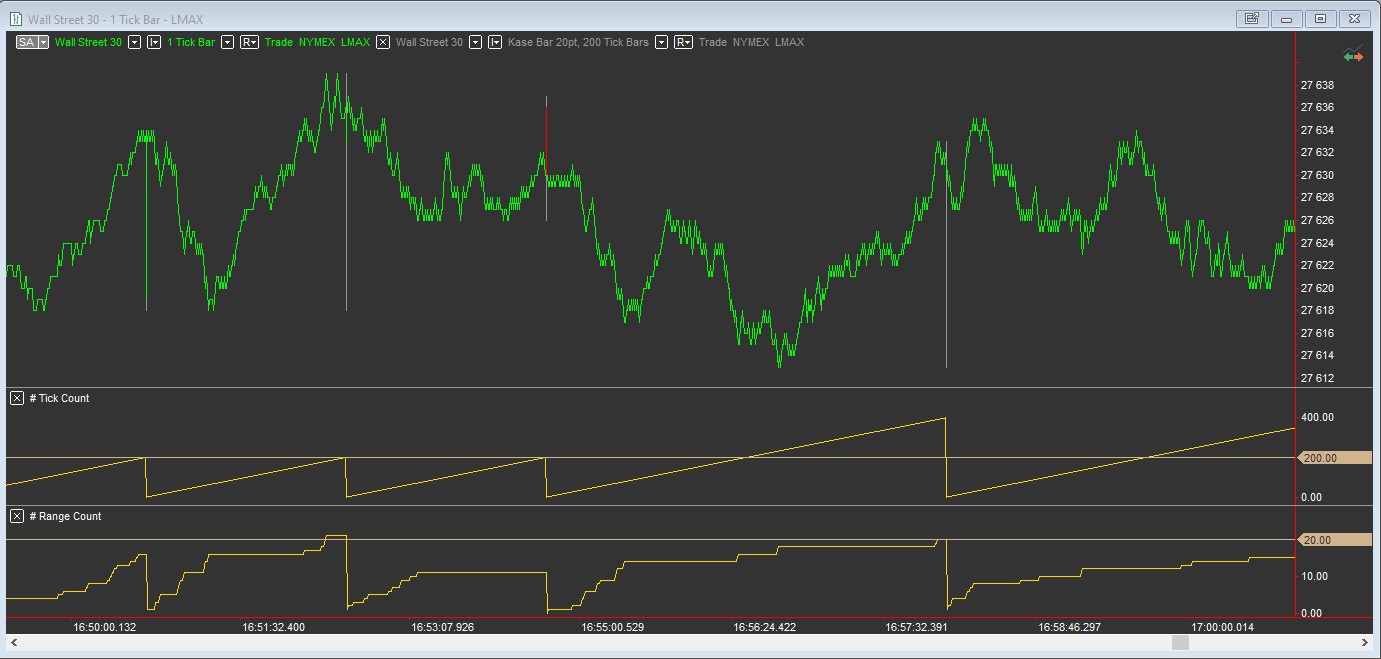
In this situation, the range exeeding rule you mentionned is not true for what I see. Here is below an attempt to illustrate. I plot a 1 tick chart, then apply Kase bar with a higher resolution as data2 (20 points / 200 ticks). I constructed simple counting indicators for the number of ticks and points range accumulated within a bar. Some bar do have a lower range than the specified range. What are the rules to start a new bar in this case ?
Yet, you might have missed part of my point. I was not referering to kase bar construction per se, which is well understood in the case we use a tick by tick resolution. My questions were addressed in the very specific context where we apply them on a resolution larger than 1 tick, for instance 600 ticks.
In this situation, the range exeeding rule you mentionned is not true for what I see. Here is below an attempt to illustrate. I plot a 1 tick chart, then apply Kase bar with a higher resolution as data2 (20 points / 200 ticks). I constructed simple counting indicators for the number of ticks and points range accumulated within a bar. Some bar do have a lower range than the specified range. What are the rules to start a new bar in this case ?
-
Svetlana MultiCharts
- Posts: 645
- Joined: 19 Oct 2017
- Has thanked: 3 times
- Been thanked: 163 times
Re: Kase bar resolution
Mydesign,
The point is that if we use Kase Bar with 1 tick resolution, Kase Bar will be calculated on all 1 tick bars of the base resolution. The base resolution is important for Kase Bar plotting, as, for example 200 tick resolution means that not all ticks will be available for Kase Bar plotting.
The true range will be calculated on specific points of the base 200-tick resolution:
– the previous Close[1] of 200-tick bar;
– High and Low of the current 200-tick bar.
As the base resolution is different (1 tick and 200 tick), the corresponding Kase Bar charts are different.
There are more opportunities to generate a Kase bar if it is based on 1 tick, as the calculation happens each tick. If Kase Bar is based on 200 tick resolution, the calculation happens once per 200 ticks (1 time in a 200-tick bar). Therefore it is not correct to compare 200-tick Kase bars with any bars that do not correspond to its base resolution (such as 1 tick bars).
If you want us to analyze your specific case in more details, please send us the following files directly to our support email address so that we would be able to investigate the issue:
1. The workspace where the issue is reproduced.
2. Export of used symbols (with data) from QuoteManager in .qmd archive: http://www.multicharts.com/trading-soft ... rting_Data
3. The exported scripts with all dependent functions that are used on the workspace (including your Range Count indicator): http://www.multicharts.com/trading-soft ... ng_Studies
4. Specify the exact time of the bar with which you have the issue.
The point is that if we use Kase Bar with 1 tick resolution, Kase Bar will be calculated on all 1 tick bars of the base resolution. The base resolution is important for Kase Bar plotting, as, for example 200 tick resolution means that not all ticks will be available for Kase Bar plotting.
The true range will be calculated on specific points of the base 200-tick resolution:
– the previous Close[1] of 200-tick bar;
– High and Low of the current 200-tick bar.
As the base resolution is different (1 tick and 200 tick), the corresponding Kase Bar charts are different.
There are more opportunities to generate a Kase bar if it is based on 1 tick, as the calculation happens each tick. If Kase Bar is based on 200 tick resolution, the calculation happens once per 200 ticks (1 time in a 200-tick bar). Therefore it is not correct to compare 200-tick Kase bars with any bars that do not correspond to its base resolution (such as 1 tick bars).
The bar range is not a characteristic that is considered to open a new Kase bar. True range — is a characteristic to open a new Kase bar.Some bar do have a lower range than the specified range. What are the rules to start a new bar in this case ?
If you want us to analyze your specific case in more details, please send us the following files directly to our support email address so that we would be able to investigate the issue:
1. The workspace where the issue is reproduced.
2. Export of used symbols (with data) from QuoteManager in .qmd archive: http://www.multicharts.com/trading-soft ... rting_Data
3. The exported scripts with all dependent functions that are used on the workspace (including your Range Count indicator): http://www.multicharts.com/trading-soft ... ng_Studies
4. Specify the exact time of the bar with which you have the issue.
Re: Kase bar resolution
Thank you Svetlana for the insight.
I was not trying to pinpoint any eventual issue, but only trying to get a better grasp on what is involved in such bar construction in this particular condition. I am now Ok with the true range vs range, calculated on base resolution bars. Thank you.
But I also wanted to assess if their reported close price is trustworthy compared to realtime price.
Since then, watching them live, I was able to figure out that the reported close price is NOT the realtime price at the time the bar actually closes, but instead the last known close price of the x tick bar (x = resolution), As you said, if Kase Bar is based on 200 tick resolution, the calculation happens once per 200 ticks (1 time in a 200-tick bar).
Said otherwise, what I see is that 200 ticks after the bar opening, if the true range has not been exeeded, the bar just freezes in time but is not closed, while realtime ticks keep coming. When the bar is finally closed (true range has been exeeded), it still stays where it was frozen in the past, with its corresponding close price.
Thus in this particular conditions (base resolution larger than 1 tick), Kase bar close does not match realtime price. Do you confirm ?
-
Svetlana MultiCharts
- Posts: 645
- Joined: 19 Oct 2017
- Has thanked: 3 times
- Been thanked: 163 times
Re: Kase bar resolution
If the true range of the base data series has not been exceeded in 200 ticks (condition X was not met), a new Kase bar does not open, while an old Kase bar continues to update, its Close, High, Low values change in real-time, but time and volume update once per a calculation (i.e. per 200 ticks). When condition X is met, the new Kase bar is opened.
Kase Bar should not freeze. Its Close price shall correspond to the Close price of the base data series.
If you notice that the Kase bar is freezing, while its base data series is updating, please make a video demonstrating it, if possible.
Kase Bar should not freeze. Its Close price shall correspond to the Close price of the base data series.
If you notice that the Kase bar is freezing, while its base data series is updating, please make a video demonstrating it, if possible.
Re: Kase bar resolution
That is indeed the case, we agree on that. But this is not the realtime price at the time it actually occurs. See attached video.Its Close price shall correspond to the Close price of the base data series.
I plot Kase Bar 20pt box size, 100 ticks base resolution, over a tick by tick chart to get realtime price reference. Bottom data is the corresponding base data series.
Once the base resoltuion bar is closed, the Kase bar is freezing in time while it is not yet closed, and while realtime ticks keep coming and while the base resolution bar has started a new bar. When it will eventually close (true range exeeded, not seen on the video), it will retain the price from were it was, corresponding to the last know base resolution close price, not the realtime price.
- Attachments
-
- Video_19-12-13_18-28-18.gif
- (1 MiB) Not downloaded yet
Last edited by Mydesign on 04 Mar 2020, edited 1 time in total.
-
Svetlana MultiCharts
- Posts: 645
- Joined: 19 Oct 2017
- Has thanked: 3 times
- Been thanked: 163 times
Re: Kase bar resolution
The behavior when the bar “freezes” in time, i.e. its price is updating, while time and volume are not updating, is expected for the current realization. The time stamp of a non-standard bar is assigned according to the last bar of the base resolution that was included in the non-standard bar.
Re: Kase bar resolution [SOLVED]
Ok. The time stamp... AND therefore its corresponding close price (back in time <> realtime).
Nevermind, I figured out what I needed to regarding backtest accuracy (question #1). Thanks a lot for your time and efforts.
Nevermind, I figured out what I needed to regarding backtest accuracy (question #1). Thanks a lot for your time and efforts.