I've noticed that when using automated strategies using Line Break or Kagi charts, there is a great discrepancy between realtime and backtested results. For example, the number of trades is substantially different.
I understand the difference between realtime and backtesting. But I'm surprised at this wide gulf between the two using these kinds of charts. Does anyone have any advice on how to backtest automated strategies on Line Break or Kagi charts to yield results that are in the same ballpark as realtime results?
Backtesting vs. Realtime with Line Break and Kagi Charts
-
TJ

- Posts: 7742
- Joined: 29 Aug 2006
- Location: Global Citizen
- Has thanked: 1033 times
- Been thanked: 2222 times
Re: Backtesting vs. Realtime with Line Break and Kagi Charts
are you using Bar Magnifier for backtesting?I've noticed that when using automated strategies using Line Break or Kagi charts, there is a great discrepancy between realtime and backtested results. For example, the number of trades is substantially different.
I understand the difference between realtime and backtesting. But I'm surprised at this wide gulf between the two using these kinds of charts. Does anyone have any advice on how to backtest automated strategies on Line Break or Kagi charts to yield results that are in the same ballpark as realtime results?
-
Algyros

- Posts: 52
- Joined: 28 Sep 2009
- Location: Austin, TX
- Has thanked: 1 time
- Been thanked: 5 times
Re: Backtesting vs. Realtime with Line Break and Kagi Charts
According to my "Strategy Properties" window, "Bar Magnifier is unavailable for non-regular charts." Is there another way I could use the bar magnifier?
-
TJ
- Posts: 7742
- Joined: 29 Aug 2006
- Location: Global Citizen
- Has thanked: 1033 times
- Been thanked: 2222 times
Re: Backtesting vs. Realtime with Line Break and Kagi Charts
are you using Intra-bar Order Generation?
-
Dave Masalov

- Posts: 1712
- Joined: 16 Apr 2010
- Has thanked: 51 times
- Been thanked: 489 times
Re: Backtesting vs. Realtime with Line Break and Kagi Charts
Dear Algyros,
For NCT charts signals are calculated differently on historical data and in real-time.
For NCT charts signals are calculated differently on historical data and in real-time.
Re: Backtesting vs. Realtime with Line Break and Kagi Charts
Dear Algyros,
For NCT charts signals are calculated differently on historical data and in real-time.
Hi Dave,
Can you please elaborate how the calculations are done differently on historical data and real-time?
I ask since I wish to confirm it's because the compressed data differs from the real-time data hence the strategy applied will obviously differ for the two.
I do believe however that there is a way to work around this natural discrepancy if one chooses and figures out a way to send the signal based on compressed data every 5 second or so just absorb the delay as slippage but mostly be in the correct direction of the market. One would need to use GV's, and basically manage the signals in arrays to choose which ones to fire off, etc. based on the DB of data/signals and management of market positions.
I also keen to know if others are working on this type of trading in depth. Please free to private msg. Thanks!
mno
-
shadrock55
- Posts: 51
- Joined: 24 Feb 2011
- Location: Atlanta, GA
- Has thanked: 5 times
- Been thanked: 8 times
Re: Backtesting vs. Realtime with Line Break and Kagi Charts
Back when I was on TS, I ran a line break strategy. There are a few coding intricicies that existed there that I believe exist here as well that may close the gap.
1. Make sure that all orders in the backtest are executed "On Close". Any other order type will be innaccurate. "At the market" orders execute a bar late too late, and stop orders can cause a bunch of issues if you aren't careful.
2. Make sure you are using a one tick resolution. Otherwise, it will calculate wrong.
3. Make sure you break on close of the day. Otherwise your chart will be different every time you create one.
4. Make sure that you do not use any exit stops closer than the line break. You "may" be hit in live trading, but not in backtest.
If you aren't doing these things, they can make a great backtest strategy go negative in a hurry.
Dave can verify if any, and all, of these things need to be done on MC. You can probably search the web and find TS's generic message on special treatment of advanced bar types. Hope this helps.
-
TJ
- Posts: 7742
- Joined: 29 Aug 2006
- Location: Global Citizen
- Has thanked: 1033 times
- Been thanked: 2222 times
Re: Backtesting vs. Realtime with Line Break and Kagi Charts
Before careful when backtesting with non-time based charts, especially range based chart... they simply don't do well, not because of MultiCharts... use any charting program and you will get the same inconsistency.
One of the problem is, range based charts are hindsights.
Let me explain:
on a time based chart, a new bar is formed when the time is up.
on a tick/volume chart, a new bar is formed when the tick/volume is met.
on a range based bar, a new bar is form when the trade has exceeded a specifed range.
ie. you DO NOT know when is the "CLOSE" of a bar until after the fact.
The problem lies in the fact that when a range based chart starts a new bar, it is by definition outside of the previous bar's range, and thus the slipperage is guaranteed NOT in your favor. However in backtesting, these slipperage are often overlooked.
Re: Backtesting vs. Realtime with Line Break and Kagi Charts
Everyone should stay with the proper nomenclature to prevent any more confusion. The Bar Magnifier message quoted something called the Non-Regular Chart, presumably that abbreviation should be NRC. TS calls them Advanced charts which include Kagi, Kase, Line Break, Momentum, Point & Figure, Range and Renko; all of these Advanced charts could be built up from tick and minute intervals under TS (except Renko, which is only tick based interval).Dear Algyros,
For NCT charts (?) signals are calculated differently on historical data and in real-time.
In many respects, you are working blind here using MC because of the lack of proper documentation. With TS, you get several warnings from the TS documentation and forum help (LIBB mentioned below is similar to Bar-Magnifier in MC):
Range bars, which are an Advanced bar type, are based on price-activity, not time-activity. As such they do not preserve the historical sequence of market prices. Because of this, you can see differences in strategies running on historical Range bars versus live trading with Range bars, where prices may fill where no Range bars historically exist. You can obtain more information on Range bars in the on-line help by selecting Help -> TS Help -> Range Bar Chart -> Advanced Chart Types – Strategy Back-Testing and Automation.
In back-testing, the price-path within the bar is not provided for Advanced Bar types, so you may not see the trailing stop work properly within bars. Per my above post, when using trailing stops in back-testing, to accurately test may require 1-tick Look-inside-bar Back-testing (LIBB) precision, except LIBB is not available for Advanced Bar Types. Thus, you may not be able to accurately back-test trailing stops for Advanced Bar Types.
Re: Backtesting vs. Realtime with Line Break and Kagi Charts
More specifically to the original poster's question, there is an artifact to back testing these advanced charts. The artifact results in 100% profitable trades in back tests: To quote from the TS help on advanced charts:
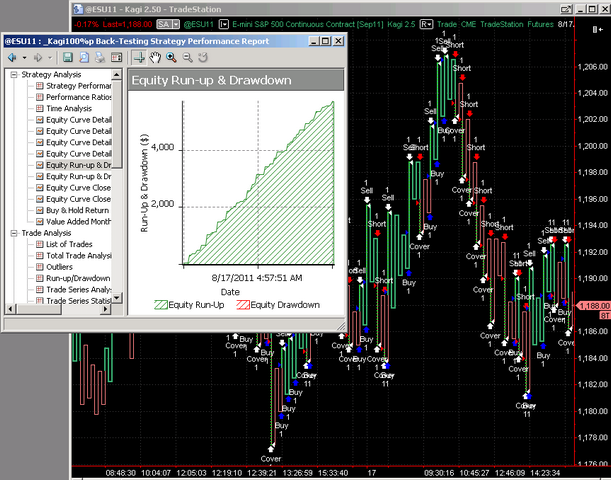
Bars on Kagi, Point & Figure, Renko, and Line Break charts, bars do not form
until prices have moved a certain amount. For this reason, when back-testing,
it is possible to know the direction of the bar, and to guarantee that the
bar is of a certain size, before initiating a trade. To illustrate this
effect, the following strategy can be placed on a P&F, Renko or Line Break
Chart and will show 100% profitability in back-testing:}
Sell short next bar low stop ;
Buy to cover this bar close ;
Buy next bar high stop ;
Sell this bar close ;
{On a Kagi chart, the following code will illustrate the same effect (100%
profitable):}
Buy next bar High + Minmove / PriceScale stop ;
Sell short next bar Low - MinMove / PriceScale stop ;
Sell this bar Close ;
Buy to cover this bar Close ;
- Attachments
-
- AdvancedChartTypes–StrategyBack-Testing.TXT
- (4.26 KiB) Downloaded 404 times
-
- Kagi100%2011-08-17.png
- (184.32 KiB) Downloaded 1656 times