Page 1 of 1

two data series, two time templates

Posted: 21 Jan 2014
by arnie
I'm having a problem here regarding calling data from data2 and I'd like to know if is a code issue or a MC issue and how multiple session templates are managed.

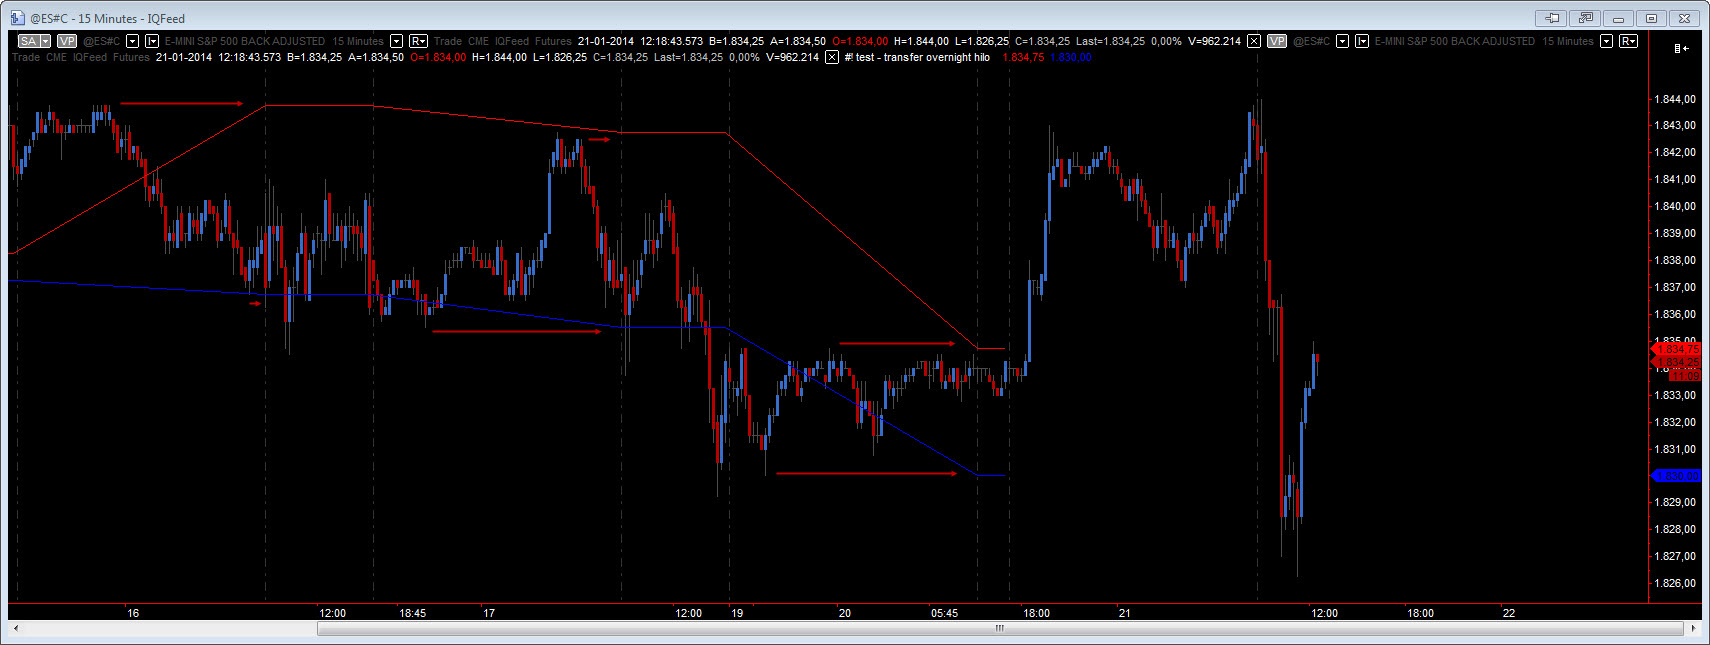
Like I said, I have two data series in which one plots the RTH session and the other the ETH session.

The idea here is to plot on the RTH session the high and low of the ETH.

Historically speaking, the code seems to do what is meant do to but for some reason, it does not plot the last ETH session.

Image

Any help?
What am I'm missing?

Code: Select all

variables:
sessHi (0, data2),
sessLo (0, data2),
CurrentSess (0, data2);

CurrentSess = CurrentSession(0) of data2;

if CurrentSess <> CurrentSess[1] then begin
sessHi = -999999;
sessLo = +999999;
end;

if High of data2 > SessHi then
SessHi = High of data2;
if Low of data2 < SessLo then
SessLo = Low of data2;

plot1(SessHi,"Session High");
plot2(SessLo,"Session Low");

Re: two data series, two time templates

Posted: 26 Jan 2014
by JoshM
I see that the first reference to the CurrentSession function was made in 2010 on the forum; since then a lot has changed. Have you tried using one of the session keywords instead of the function?

It might be that this function only updates it value at the end of the session, looking at your chart.

I suspect that, if you have one session per day (either RTH or ETH), you can replace

Code: Select all

if CurrentSess <> CurrentSess[1] then begin
sessHi = -999999;
sessLo = +999999;
end;
with

Code: Select all

if Date <> Date[1] then begin
sessHi = -999999;
sessLo = +999999;
end;

Re: two data series, two time templates

Posted: 26 Jan 2014
by arnie
Date keyword resets the day at midnight.
ETH session start at 5pm in one day and end at 830am next day so Date will not read the data between 5pm and midnight.

I don't know if this is a code issue or a MC issue.
Something similar happened with the quoteboard study.
When I started to add other data series (markets), due to the different session templates for each markets, the study would not reset properly although when used on a single data series the study was working fine.

So it seems MC does not like multiple data series with different session templates. It seems MC cannot separate each template from each data series and end up mixing them.

I'm waiting for a reply from the developers to see what is happening here.

Re: two data series, two time templates

Posted: 31 Jan 2014
by JoshM
(...)
I'm waiting for a reply from the developers to see what is happening here.
Did you get a response? I'd be interested to hear what the issue/error was causing this.

Re: two data series, two time templates

Posted: 31 Jan 2014
by arnie
(...)
I'm waiting for a reply from the developers to see what is happening here.
Did you get a response? I'd be interested to hear what the issue/error was causing this.
Not yet :(

Re: two data series, two time templates

Posted: 31 Jan 2014
by arnie
Here is the thread of the quoteboard study for those that don't remember it

viewtopic.php?f=1&t=11804&hilit=quoteboards

Re: two data series, two time templates

Posted: 31 Jan 2014
by sptrader
Maybe something like this : it plots the previous days ETH highs and lows(data2) on the current RTH data1 chart...(if that's what you want)..might need some tweaking..

Code: Select all

Vars:hi(0,data2),Lo(0,data2);

hi = highD(1) of data2;// eth high
Lo = LowD(1) of data2;//eth Low

plot1(hi,"Eth Hi");
plot2(Lo,"Eth Lo");

Re: two data series, two time templates

Posted: 31 Jan 2014
by arnie
Maybe something like this : it plots the previous days ETH highs and lows(data2) on the current RTH data1 chart...(if that's what you want)..might need some tweaking..

If we plot your code and the data2 only shows globex session, 1700 till 830, we get the exact same result, no lines for today's RTH session.

If data2 is a 24h session (1700 till 1515), I don't use the last 45min of the day on ES, the result is on the attached image.
On the RTH series you indeed get previous day high and low, which in this case, since we have a 24h session, the high which is being plotted was made on the RTH session and not on the ETH.

Also, you are reporting to yesterday's high and not today's overnight session high.

Another issue is the fact the yesterday's low refers to the low made around 3am CT but the actual low was made around 8:30pm CT. HighD and all similar functions reset the day at midnight. When we deal with 24h sessions, namely future sessions the only function capable of recognizing the overnight is the CurrentSession.

ABC coded for me a couple of years ago a study that reads perfectly the overnight session but amazingly it does not work when I add a second data series.
Everytime I add a second data series the overnight high and low reading is made after midnight. All data between 5pm and midnight is not considered.

Again, it seems that data1 session template takes precedence over all other data series session templates.
If data1 is plotting RTH session only and your data2 plots ETH data and your study retrieves data from the ETH correctly, since you're plotting the results on the RTH chart (data1), all data2 data prior to midnight will not be considered.


Image

Re: two data series, two time templates

Posted: 06 Feb 2014
by arnie
(...)
I'm waiting for a reply from the developers to see what is happening here.
Did you get a response? I'd be interested to hear what the issue/error was causing this.
According to developers this is a code issue and not a MC issue.
I don't know...

Unfortunately my programming knowledge is limited for me to continue to pursue this issue.
Maybe one of the experts on the forum might want to confirm if this is in fact a code issue or a MC issue when applying a second session template on the second data series.