So today I spent the entire afternoon trying to make this more user friendly for me.
I ended up setting the study to support 8 data series.
We can set the color for each series through inputs. Also we need to select how many series are we using and if only 4 are used we need to switch to False the respective Series# input.
Labels are available and I decided to add the % so one can have a better reading of the move. Also, labels are plotted on the far right of the chart. I decided to remove the price scale from the chart for simplicity.
I removed the date input because I have no use for it. My interest is purely for the day. I add an input to only show today's session and remove the history. This input only works for RTH session templates.
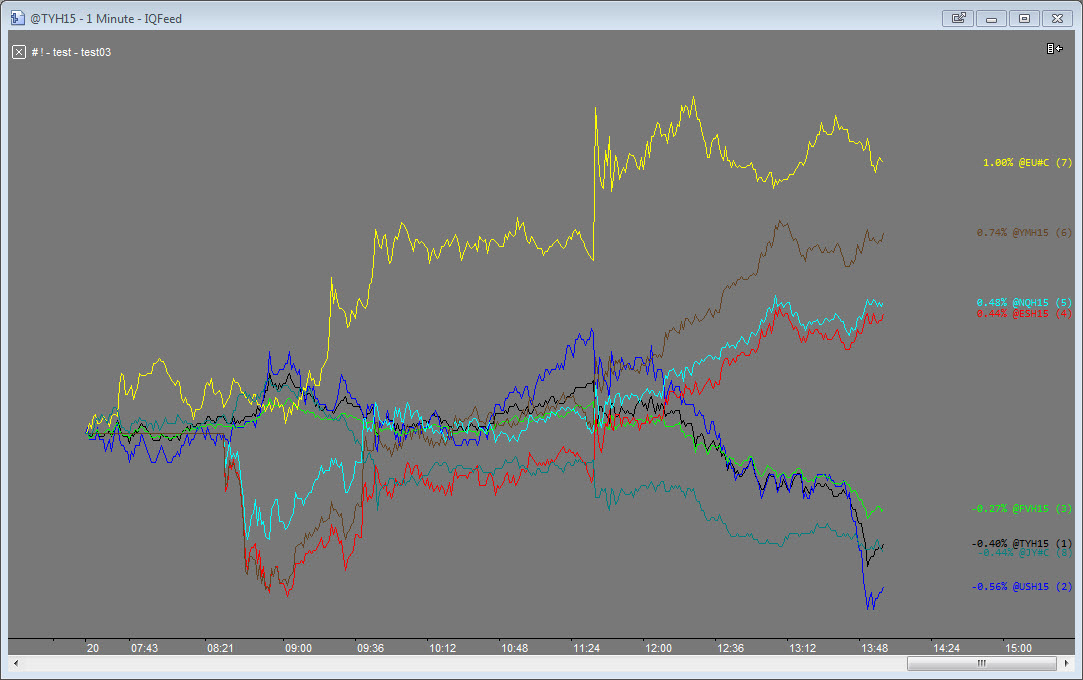
This study was not yet tested during live markets so I cannot promise that this will work flawlessly.
I tested it by playback the chart and all seemed OK though playback more then 5 symbols the study did not reset properly but I have no idea if it's due to the playback.
Monday we give it a try.
Please feel free to improve it.
Code: Select all
// 140330 V01

// 1502180159 some comments

// Yves BENOIT y.benoit@yahoo.fr


// 150221 V02

// http://www.multicharts.com/discussion/viewtopic.php?f=1&t=48218


inputs:

	dataSeries		(4),

	ShowHistory		(false),

	ShowLabels		(true),

	LabelFont		("consolas"),

	LabelSize		(8),

	Series1		(true),

	Color1			(black),

	Series2		(true),

	Color2			(blue),

	Series3		(true),

	Color3			(green),

	Series4		(true),

	Color4			(red),

	Series5		(false),

	Color5			(cyan),

	Series6		(false),

	Color6			(darkbrown),

	Series7		(false),

	Color7			(yellow),

	Series8		(false),

	Color8			(darkcyan);


variables:

	todaySession		(0),

	newDay			(false),

	ii			(0),

	pctchg1		(0),

	pctchg2		(0),

	pctchg3		(0),

	pctchg4		(0),

	pctchg5		(0),

	pctchg6		(0),

	pctchg7		(0),

	pctchg8		(0),

	series1Txt		(-1),

	series2Txt		(-1),

	series3Txt		(-1),

	series4Txt		(-1),

	series5Txt		(-1),

	series6Txt		(-1),

	series7Txt		(-1),

	series8Txt		(-1);


arrays:

	Coef[]			(0),

	TxtStr[]		(""),

	PrevCl[]		(0);


once begin

	Array_SetMaxIndex(Coef, dataSeries);

	Array_SetMaxIndex(TxtStr, dataSeries);

	Array_SetMaxIndex(PrevCl, dataSeries);


	if ShowLabels = true then begin

		series1Txt = text_new_self_s(date, time_s, 0, "");

			text_setstyle(series1Txt, 1, 2);

			text_setsize(series1Txt, labelsize);

			text_setfontname(series1Txt, LabelFont);

			text_setcolor(series1Txt, color1);

			text_lock(series1Txt, true);

		series2Txt = text_new_self_s(date, time_s, 0, "");

			text_setstyle(series2Txt, 1, 2);

			text_setsize(series2Txt, labelsize);

			text_setfontname(series2Txt, LabelFont);

			text_setcolor(series2Txt, color2);

			text_lock(series2Txt, true);

		series3Txt = text_new_self_s(date, time_s, 0, "");

			text_setstyle(series3Txt, 1, 2);

			text_setsize(series3Txt, labelsize);

			text_setfontname(series3Txt, LabelFont);

			text_setcolor(series3Txt, color3);

			text_lock(series3Txt, true);

		series4Txt = text_new_self_s(date, time_s, 0, "");

			text_setstyle(series4Txt, 1, 2);

			text_setsize(series4Txt, labelsize);

			text_setfontname(series4Txt, LabelFont);

			text_setcolor(series4Txt, color4);

			text_lock(series4Txt, true);

		series5Txt = text_new_self_s(date, time_s, 0, "");

			text_setstyle(series5Txt, 1, 2);

			text_setsize(series5Txt, labelsize);

			text_setfontname(series5Txt, LabelFont);

			text_setcolor(series5Txt, color5);

			text_lock(series5Txt, true);

		series6Txt = text_new_self_s(date, time_s, 0, "");

			text_setstyle(series6Txt, 1, 2);

			text_setsize(series6Txt, labelsize);

			text_setfontname(series6Txt, LabelFont);

			text_setcolor(series6Txt, color6);

			text_lock(series6Txt, true);

		series7Txt = text_new_self_s(date, time_s, 0, "");

			text_setstyle(series7Txt, 1, 2);

			text_setsize(series7Txt, labelsize);

			text_setfontname(series7Txt, LabelFont);

			text_setcolor(series7Txt, color7);

			text_lock(series7Txt, true);

		series8Txt = text_new_self_s(date, time_s, 0, "");

			text_setstyle(series8Txt, 1, 2);

			text_setsize(series8Txt, labelsize);

			text_setfontname(series8Txt, LabelFont);

			text_setcolor(series8Txt, color8);

			text_lock(series8Txt, true);

	end;

end;


todaySession = CurrentSession(0);


if todaySession <> todaySession[1] then begin

	newDay = true;


	for ii  = 1 to dataSeries begin

		Coef[ii] = 100 / close of data(ii);

		TxtStr[ii] = Symbol of data(ii);

		PrevCl[ii] = close of data(ii);

	end;

end;


if newDay then begin

	if Series1 = true then begin

		ii = 1;

		pctchg1 = ((close of data(ii) / PrevCl[ii]) - 1) * 100;

		text_setstring(series1Txt, numtostr(pctchg1, 2) + "%" + " " + txtstr[ii] + " " + "(1)");


		if ShowHistory = true or (ShowHistory = false and (LastCalcDate = date)) then begin

			Plot1(close of Data(ii) * Coef[ii], "Pct1", color1);

			if barstatus(ii) = 2 then

				text_setlocation_s(series1Txt, JulianToDate(GetAppInfo(airightDispDateTime)),DateTime2ELTime_s(GetAppInfo(airightDispDateTime)),

					close of data(ii) * coef[ii]);

		end;

	end;

	if Series2 = true then begin

		ii = 2;

		pctchg2 = ((close of data(ii) / PrevCl[ii]) - 1) * 100;

		text_setstring(series2Txt,  numtostr(pctchg2, 2) + "%" + " " + txtstr[ii] + " " + "(2)");


		if ShowHistory = true or (ShowHistory = false and (LastCalcDate = date)) then begin

			Plot2(close of Data(ii) * Coef[ii], "Pct2", color2);

			if barstatus(ii) = 2 then

				text_setlocation_s(series2Txt, JulianToDate(GetAppInfo(airightDispDateTime)),DateTime2ELTime_s(GetAppInfo(airightDispDateTime)),

					close of data(ii) * coef[ii]);

		end;

	end;

	if Series3 = true then begin

		ii = 3;

		pctchg3 = ((close of data(ii) / PrevCl[ii]) - 1) * 100;

		text_setstring(series3Txt,  numtostr(pctchg3, 2) + "%" + " " + txtstr[ii] + " " + "(3)");


		if ShowHistory = true or (ShowHistory = false and (LastCalcDate = date)) then begin

			Plot3(close of Data(ii) * Coef[ii], "Pct3", color3);

			if barstatus(ii) = 2 then

				text_setlocation_s(series3Txt, JulianToDate(GetAppInfo(airightDispDateTime)),DateTime2ELTime_s(GetAppInfo(airightDispDateTime)),

					close of data(ii) * coef[ii]);

		end;

	end;

	if Series4 = true then begin

		ii = 4;

		pctchg4 = ((close of data(ii) / PrevCl[ii]) - 1) * 100;

		text_setstring(series4Txt,  numtostr(pctchg4, 2) + "%" + " " + txtstr[ii] + " " + "(4)");


		if ShowHistory = true or (ShowHistory = false and (LastCalcDate = date)) then begin

			Plot4(close of Data(ii) * Coef[ii], "Pct4", color4);

			if barstatus(ii) = 2 then

				text_setlocation_s(series4Txt, JulianToDate(GetAppInfo(airightDispDateTime)),DateTime2ELTime_s(GetAppInfo(airightDispDateTime)),

					close of data(ii) * coef[ii]);

		end;

	end;

	if Series5 = true then begin

		ii = 5;

		pctchg5 = ((close of data(ii) / PrevCl[ii]) - 1) * 100;

		text_setstring(series5Txt,  numtostr(pctchg5, 2) + "%" + " " + txtstr[ii] + " " + "(5)");


		if ShowHistory = true or (ShowHistory = false and (LastCalcDate = date)) then begin

			Plot5(close of Data(ii) * Coef[ii], "Pct1", color5);

			if barstatus(ii) = 2 then

				text_setlocation_s(series5Txt, JulianToDate(GetAppInfo(airightDispDateTime)),DateTime2ELTime_s(GetAppInfo(airightDispDateTime)),

					close of data(ii) * coef[ii]);

		end;

	end;

	if Series6 = true then begin

		ii = 6;

		pctchg6 = ((close of data(ii) / PrevCl[ii]) - 1) * 100;

		text_setstring(series6Txt,  numtostr(pctchg6, 2) + "%" + " " + txtstr[ii] + " " + "(6)");


		if ShowHistory = true or (ShowHistory = false and (LastCalcDate = date)) then begin

			Plot6(close of Data(ii) * Coef[ii], "Pct2", color6);

			if barstatus(ii) = 2 then

				text_setlocation_s(series6Txt, JulianToDate(GetAppInfo(airightDispDateTime)),DateTime2ELTime_s(GetAppInfo(airightDispDateTime)),

					close of data(ii) * coef[ii]);

		end;

	end;

	if Series7 = true then begin

		ii = 7;

		pctchg7 = ((close of data(ii) / PrevCl[ii]) - 1) * 100;

		text_setstring(series7Txt,  numtostr(pctchg7, 2) + "%" + " " + txtstr[ii] + " " + "(7)");


		if ShowHistory = true or (ShowHistory = false and (LastCalcDate = date)) then begin

			Plot7(close of Data(ii) * Coef[ii], "Pct3", color7);

			if barstatus(ii) = 2 then

				text_setlocation_s(series7Txt, JulianToDate(GetAppInfo(airightDispDateTime)),DateTime2ELTime_s(GetAppInfo(airightDispDateTime)),

					close of data(ii) * coef[ii]);

		end;

	end;

	if Series8 = true then begin

		ii = 8;

		pctchg8 = ((close of data(ii) / PrevCl[ii]) - 1) * 100;

		text_setstring(series8Txt,  numtostr(pctchg8, 2) + "%" + " " + txtstr[ii] + " " + "(8)");


		if ShowHistory = true or (ShowHistory = false and (LastCalcDate = date)) then begin

			Plot8(close of Data(ii) * Coef[ii], "Pct4", color8);

			if barstatus(ii) = 2 then

				text_setlocation_s(series8Txt, JulianToDate(GetAppInfo(airightDispDateTime)),DateTime2ELTime_s(GetAppInfo(airightDispDateTime)),

					close of data(ii) * coef[ii]);

		end;

	end;

end;