Page 1 of 1
[PL] Divergence line chopping off a candle
Posted: 12 Apr 2010
by duration
Dear All,
I am working on the markplex tutorial #26:
http://markplex.com/tutorial26.php
I use exactly the same code, and have adapted it to plot type 1 & 2 divergence lines:
http://www.elitetrader.com/tr/index.cfm ... tion=print
On the attached screenshot, you might see that the divergence line chops off the top of the candle before the pivot.
I am wondering how to tell PL that the top of the candle is chopped off by the divergence line, so that nothing is plotted if a candle is chopped off.
Do you have any idea?
Many thanks
Posted: 12 Apr 2010
by TJ
what is the chart resolution?
Posted: 12 Apr 2010
by duration
Dear TJ,
It is 5 Range.
Many thanks,
Posted: 12 Apr 2010
by TJ
change the TL_NEW to TL_NEW_S.
all sub-minute and non time-based resolutions must use the _S suffixed keywords.
Posted: 12 Apr 2010
by duration
Dear TJ,
I am already using the "_s" extensions.
The divergence line plots right, I am just trying to find how it could not plot if it has to go through the body of a candle before its end point.
Many thanks,
Posted: 12 Apr 2010
by TJ
Dear TJ,
I am already using the "_s" extensions.
The divergence line plots right, I am just trying to find how it could not plot if it has to go through the body of a candle before its end point.
Many thanks,
sorry... can't tell if you don't post your code.
try this:
right click on chart,
go to
Format Studies,
in the
Scaling tab,
under
Scaling Range,
select
Same as Instrument.
Posted: 12 Apr 2010
by duration
Dear TJ,
Thank you very much for your suggestion but it does not work, the top of the candle is still chopped off, I think it will still be chopped off whatever the scaling.
In any case, I am looking how to make PL understands that the line is chopping a candle.
Many thanks,
Posted: 13 Apr 2010
by duration
The lines also chop off the indicator sometimes... is there no way to tell powerlanguage how to detect that there is something on the way of the tl_new?
Posted: 13 Apr 2010
by TJ
The lines also chop off the indicator sometimes... is there no way to tell powerlanguage how to detect that there is something on the way of the tl_new?
read the 1st line in the 6th post again...
Posted: 13 Apr 2010
by duration
Dear TJ,
The code is the same as markplex, on the first post, there is a link.
The other link shows divergence types.
Posted: 15 Apr 2010
by duration
No one has an idea of to make powerlanguage detect that a trendline is going through the body of a candle?
I just cannot figure out

Posted: 15 Apr 2010
by TJ
like I said, can't tell if... I don't see the code, don't know the symbol, don't know the resolution, don't have a detail chart, don't know your intention, etc...
you think the code is the "same" as whatever...
I think I don't work in a vacuum...
Posted: 15 Apr 2010
by duration
Dear TJ,
My apologies if I wwas not clear enough, I did not mean to upset you.
Here is the code:
Code: Select all
// http://markplex.com/tutorial26.php


Inputs : PriceL(Low),StochLength(7),SmoothingLength1(3),SmoothingLength2(3),SmoothingType(1),

     Length(20),LeftStrength(3),RightStrength(1),BarTol(3);


vars: ofastk(0),oFastD(0),oSlowk(0),oSlowD(0),oPivotPrice1(0),oPivotBar1(0),oPivotPrice2(0),oPivotBar2(0),

oPivotPrice3(0),oPivotBar3(0),oPivotPrice4(0),oPivotBar4(0);


Value1=Stochastic(H,L,C,StochLength,SmoothingLength1,SmoothingLength2,SmoothingType,ofastk,ofastd,oslowk,oslowd);


//Determine if pivots in the price have occurred

Condition3 = Pivot(PriceL,Length,LeftStrength,RightStrength,1,-1,oPivotPrice3,oPivotBar3)<>-1;

Condition4 = Pivot(PriceL,Length,LeftStrength,RightStrength,2,-1,oPivotPrice4,oPivotBar4)<>-1;


//Determine if pivots in the stochstic have occurred

Condition1 = Pivot(oslowd,Length,LeftStrength,RightStrength,1,-1,oPivotPrice1,oPivotBar1)<>-1;

Condition2 = Pivot(oslowd,Length,LeftStrength,RightStrength,2,-1,oPivotPrice2,oPivotBar2)<>-1;


if condition3 and condition4 and condition1 and condition2

and (absvalue(oPivotbar1-oPivotBar3)<BarTol)

and (absvalue(oPivotbar2-oPivotBar4)<BarTol)

and (oPivotBar3 = RightStrength or oPivotbar1 = RightStrength)

and (oPivotPrice3<=oPivotPrice4 and oPivotPrice1>oPivotPrice2) and barstatus(1)=2 then

      begin

      value2= tl_new_S(D[oPivotBar4],Time_S[oPivotBar4],L[oPivotBar4],D[oPivotBar3],Time_s[oPivotBar3],L[oPivotBar3]);

      tl_setcolor(value2,Green);

      tl_setsize   (value2,1);


      value3= tl_new_Self_s(D[oPivotBar1],Time_S[oPivotBar1],oPivotPrice1,D[oPivotBar2],Time_s[oPivotBar2],oPivotPrice2);

      tl_setcolor(value3,Green);

      tl_setsize   (value3,1);


      end;

Plot1(oSlowD);
Please find attached a 6B data sample, that needs to be plotted using a 5 point resolution, and a screenshot showing a line chopping a candle wick.
It happened the 02/18/2010 at 18:05:21.
Let me know if you need anything,
Many thanks,
Posted: 15 Apr 2010
by duration
Data sample 01, rename to 6B 06-10.zip.001
Posted: 15 Apr 2010
by duration
Data sample 02, rename to 6B 06-10.zip.002
Posted: 15 Apr 2010
by duration
Data sample 03, the last one, to rename to 6B 06-10.zip.003
Posted: 15 Apr 2010
by TJ
what do you mean by "chopping"?
are you referring to the intermediate candles between the 2 points?
or
are you referring to the end points are too thick, covering part of the candle?
can you magnify the area and use an arrow to point out the specific "chop" that needs modification?
Posted: 15 Apr 2010
by duration
By chopping I mean that the trendline goes through the body/wick of a candle.
You can see it circled in red on this new screenshot.
Posted: 15 Apr 2010
by TJ
By chopping I mean that the trendline goes through the body/wick of a candle.
You can see it circled in red on this new screenshot.
I gather, although the chopped candle made a low,
that low was not a "significant" low,
and that a latter low is where the divergent point lies.
Thus the line has to go through the chopped candle
to arrive at the significant low.
I do not see it as a "problem".
but if you want modification, how would you propose the line be drawn?
can you use that same chart and make a hand drawn line to illustrate your view?
Posted: 15 Apr 2010
by duration
Actually, I would like the line not to be drawn if it has to go through a candle like on the screenshot. This is why I am asking if it is possible to make powerlanguage detect that the line is going through a candle.
Posted: 15 Apr 2010
by TJ
Actually, I would like the line not to be drawn if it has to go through a candle like on the screenshot. This is why I am asking if it is possible to make powerlanguage detect that the line is going through a candle.
EasyLanguage is a flexible and power tool;
you can pretty well ask it to do any analysis you want.
All it take is a little bit of time and effort...
In this case, you will need to use
trigonometry to evaluate the intersect of the line/bar.
It can be done; it is high school math, not rocket science... but it does take time.
Posted: 15 Apr 2010
by duration
Would you have a basic example, or a tutorial? I am looking through the Math & Trig help section, but still I find it difficult to project how to do it...
Posted: 15 Apr 2010
by TJ
Would you have a basic example, or a tutorial? I am looking through the Math & Trig help section, but still I find it difficult to project how to do it...
This is not a one or two keyword operation.
It will take time to code the logic and the process...
as to the basics,
a high school math textbook would be a good starting point.
Posted: 15 Apr 2010
by duration
Sure. I think you are refering to vectors on a cartesian plane? I do not know how to programme an axix in powerlanguage
Posted: 15 Apr 2010
by Bruce DeVault
Determining if a trend line intersects price is a simple matter of looking at the two end points, calculating the slope, and using the equation "y = m x + b" to figure out the trend line's price at each bar along the way, so you can compare with those bars' low/high range. There are very likely code snippets or functions already out there that do this - even if not, it should be very short to write.
Posted: 15 Apr 2010
by SP
Maybe a second solution is to use Tl_Getvalue and look in a loop from oPivotBar4 to oPivotBar3 if the low is lower than Tl_Getvalue at this candle.
Posted: 15 Apr 2010
by janus
Determining if a trend line intersects price is a simple matter of looking at the two end points, calculating the slope, and using the equation "y = m x + b" to figure out the trend line's price at each bar along the way, so you can compare with those bars' low/high range. There are very likely code snippets or functions already out there that do this - even if not, it should be very short to write.
That is correct. In fact, I've been using this method to draw tangents to prices to form trend lines. See, it does pay to listen at maths classes

For the case in question:
1. Compute the equation of a straight line going from point a to point b.
2. For each bar between points a and b, compute the y value from the equation.
3. If you are using the lows of the points a and b to draw the line, and any of the bars has a low value < the corresponding computed y value from 2, then the line cuts through the bar so don't draw it.
4. If using the highs of the points a and b to draw the line, and any of the bars has a high value > the corresponding computed y value from 2, then the line cuts through the bar so don't draw it.
Posted: 15 Apr 2010
by duration
Thank you all so much for your replies!
Really helpful as I really did not know how to start!
I will do like you say and show you how it goes.
Many thanks,
Posted: 16 Apr 2010
by duration
Hello again !
Would you mind checking if the below is conceptually correct? I am trying to tell powerlanguage the values of each trendline point from barnumber 40 to 50, and I am not sure if a loop statement can achieve this.
Code: Select all
variables:

     PointA_y( 0 ),

     PointA_x( 0 ),

     PointB_y( 0 ),

     PointB_x( 0 ),

     Slope_m( 0 ),

     TrendLine_AB( 0 ),

     plotcondition( false ),

     noplotcondition( false );


PointA_y = oPivotPrice2 ; //1.5210

PointA_x = oPivotBar2 ; //40


PointB_y = oPivotPrice1 ; //1.5230

PointB_x = oPivotBar1 ; // 50


Slope_m = ( PointB_y - PointA_y ) / ( PointB_x - PointA_x) ; //0.0002


For CurrentBar = PointA_x to CurrentBar = PointB_x

     Begin

     TrendLine_AB = slope_m * PointA_y ;

     If Low < TrendLine_AB then noplotcondition = true;

     If Low >= Trendline_AB then plotcondition = true;

     End;
Many thanks,
Posted: 18 Apr 2010
by duration
Or maybe I have to use an array to store the value of the trendline on each bar between the two points?
I have also tried SP's solution (see the end):
Code: Select all
// http://markplex.com/tutorial26.php


Inputs : PriceL(Low),StochLength(7),SmoothingLength1(3),SmoothingLength2(3),SmoothingType(1),

     Length(20),LeftStrength(3),RightStrength(1),BarTol(3);


vars: ofastk(0),oFastD(0),oSlowk(0),oSlowD(0),oPivotPrice1(0),oPivotBar1(0),oPivotPrice2(0),oPivotBar2(0),

oPivotPrice3(0),oPivotBar3(0),oPivotPrice4(0),oPivotBar4(0);


Value1=Stochastic(H,L,C,StochLength,SmoothingLength1,SmoothingLength2,SmoothingType,ofastk,ofastd,oslowk,oslowd);


//Determine if pivots in the price have occurred

Condition3 = Pivot(PriceL,Length,LeftStrength,RightStrength,1,-1,oPivotPrice3,oPivotBar3)<>-1;

Condition4 = Pivot(PriceL,Length,LeftStrength,RightStrength,2,-1,oPivotPrice4,oPivotBar4)<>-1;


//Determine if pivots in the stochstic have occurred

Condition1 = Pivot(oslowd,Length,LeftStrength,RightStrength,1,-1,oPivotPrice1,oPivotBar1)<>-1;

Condition2 = Pivot(oslowd,Length,LeftStrength,RightStrength,2,-1,oPivotPrice2,oPivotBar2)<>-1;


if condition3 and condition4 and condition1 and condition2

and (absvalue(oPivotbar1-oPivotBar3)<BarTol)

and (absvalue(oPivotbar2-oPivotBar4)<BarTol)

and (oPivotBar3 = RightStrength or oPivotbar1 = RightStrength)

and (oPivotPrice3<=oPivotPrice4 and oPivotPrice1>oPivotPrice2) and barstatus(1)=2 then

      begin

      value2= tl_new_S(D[oPivotBar4],Time_S[oPivotBar4],L[oPivotBar4],D[oPivotBar3],Time_s[oPivotBar3],L[oPivotBar3]);

      tl_setcolor(value2,Green);

      tl_setsize   (value2,1);


      value3= tl_new_Self_s(D[oPivotBar1],Time_S[oPivotBar1],oPivotPrice1,D[oPivotBar2],Time_s[oPivotBar2],oPivotPrice2);

      tl_setcolor(value3,Green);

      tl_setsize   (value3,1);


      end;

Plot1(oSlowD);


for value10 = oPivotBar1 to value10 = oPivotbar2

     begin

     if tl_getvalue_s(value3,d[value10],time_s[value10]) < Low[value10] then tl_delete(value3);

     end;
But I have no success so far
Posted: 18 Apr 2010
by TJ
Or maybe I have to use an array to store the value of the trendline on each bar between the two points?
I have also tried SP's solution (see the end):
...
But I have no success so far
may I suggest you to draw a flow chart of your logic...
it will help you to see how the computer process your insructions.
.
Posted: 18 Apr 2010
by duration
Hi TJ,
Sure.
1. IF DIVERGENCE THEN PLOT TRENDLINE (value3)
2. THEN LOOK AT BARS FROM OPIVOTBAR1 to OPIVOTBAR2 (from where the computer will plot the divergence.
3. IF A LOW IS LOWER THAN THE TRENDLIVE VALUE AT A GIVEN BAR BETWEN OPIVOTBAR1 AND OPIVOTBAR2 THEN DELETE THE TRENDLINE (value3).
I would prefer the computer to look at both the divergence and the lower low, before plotting a trendline, but I don't know how to get the value of the trendline if it has not plotted, so I tell it to plot and THEN to look for the lower low..
Posted: 18 Apr 2010
by TJ
Hi TJ,
Sure.
1. IF DIVERGENCE THEN PLOT TRENDLINE (value3)
2. THEN LOOK AT BARS FROM OPIVOTBAR1 to OPIVOTBAR2 (from where the computer will plot the divergence.
3. IF A LOW IS LOWER THAN THE TRENDLIVE VALUE AT A GIVEN BAR BETWEN OPIVOTBAR1 AND OPIVOTBAR2 THEN DELETE THE TRENDLINE (value3).
I would prefer the computer to look at both the divergence and the lower low, before plotting a trendline, but I don't know how to get the value of the trendline if it has not plotted, so I tell it to plot and THEN to look for the lower low..
you can get the value before the TL is drawn...
look for the
TL_NEW keyword in the code.
Posted: 18 Apr 2010
by TJ
next task:
expand this line:
2. THEN LOOK AT BARS FROM OPIVOTBAR1 to OPIVOTBAR2 (from where the computer will plot the divergence.
to find out the value at each bar.
Posted: 18 Apr 2010
by duration
Hi TJ,
Thank you for your replies.
I have read and re-read the section on TL_NEW() in the Multicharts 20 times, but I cannot figure out how to get the value of the trendline if it is not drawn
I understand that the trendline only gets an ID # when it is drawn. How can I use TL_GETVALUE() if I do not know the ID of the trendline?
For 2.:
2.1 get the bar number between oPivotBar1 & oPivotBar2, which the
For loop should get (for value10 = oPivotBar1 to value10 = oPivotbar2), so that the computer only looks at the bar between oPivot1 & oPivot2.
2.2 using the brackets
"[]" the computer is going to assign a time value to each bar (value10) between oPivotBar1 oPivotBar2
2.2 for each of the bar in the loop, test the following: if the low of the bar is lower than the trendline value of the same bar, then delete the trendline.
2.3 if no low is lower than the trendline value, then nothing is deleted.
Posted: 18 Apr 2010
by TJ
Hi TJ,
Thank you for your replies.
I have read and re-read the section on TL_NEW() in the Multicharts 20 times, but I cannot figure out how to get the value of the trendline if it is not drawn
I understand that the trendline only gets an ID # when it is drawn. How can I use TL_GETVALUE() if I do not know the ID of the trendline?
....
this is from your code above:
tl_new_S(D[oPivotBar4],Time_S[oPivotBar4],L[oPivotBar4],D[oPivotBar3],Time_s[oPivotBar3],L[oPivotBar3]);
I have highlighted the coordinates of the trendline.
these values are calculated before the trendline is drawn !
ie. before the TL_NEW statement is excuted.
but of course... you only get the beginning points and the end points.
that's why you need the step 2... to find out the value of the interim bars.
Posted: 18 Apr 2010
by duration
Oh I see!
But then I cannot use the TL_GETVALUE_S() like SP suggested, and I don't know how else I could manage to do this as my attempt to calculate the slope is a total failure so far
Posted: 18 Apr 2010
by TJ
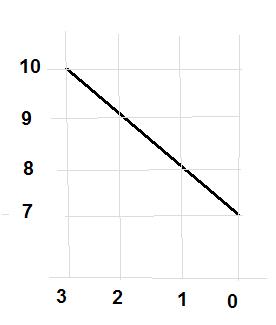
if you know the beginning point value is 10
and end point value is 7,
can you figure out how to get the intermediate values?
ps. no trigonometry is needed.
Posted: 18 Apr 2010
by duration
I calculate the slope, which is:
( 7 - 10 ) / ( 0 - 3 ) = -1
it means that for every increase in x, the value will go down by -1
10 at 3, 9 at 2, 8 at 1, 7 at 0.
Is this correct?
Posted: 18 Apr 2010
by TJ
I calculate the slope, which is:
( 7 - 10 ) / ( 0 - 3 ) = -1
it means that for every increase in x, the value will go down by -1
10 at 3, 9 at 2, 8 at 1, 7 at 0.
Is this correct?
yes... you have got the idea.
use pseudo programming language...
(end point value - beginning point value) divided by the number of bars
Posted: 18 Apr 2010
by TJ
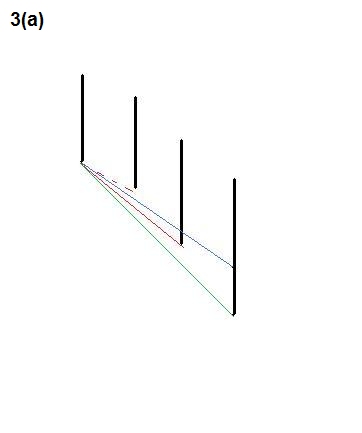
let's look at the evaluation process...
in the beginning...
when the TL is triggered,
this is how the line looks like.
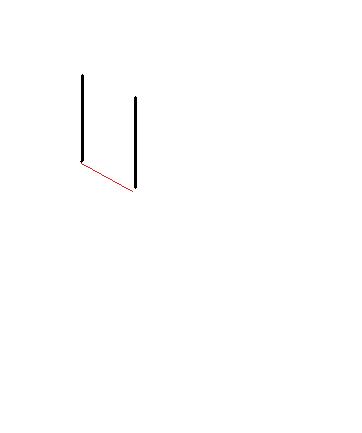
so far so good...
then the next bar came...
no problem, the indicator redraws the trendline.
Posted: 18 Apr 2010
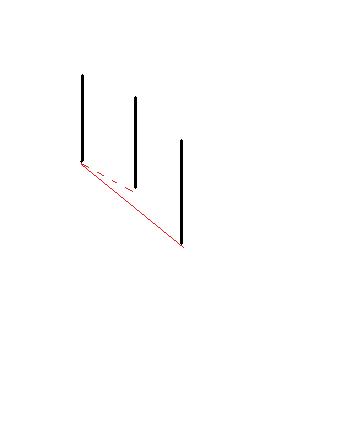
by TJ
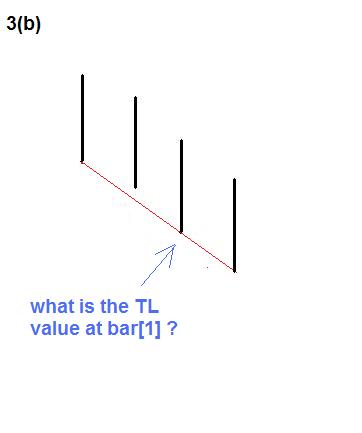
the question is...
what happens (or what do you want to do) when this occurs.
Posted: 18 Apr 2010
by TJ
I have to go out for a few hours.
I will let you think about it and I will pick this up later.
Have fun.
Posted: 18 Apr 2010
by duration
from start point to end point
add: [(end point value - beginning point value)/abs(endpointbar-startpointbar)] to each bar after the start point and stop at the one before the end point
and check in the same time if this value is higher than the low of the same bar
and if it the value is higher than the low of the same bar then have a noplot condition become "true" so that the trendline is not plotted.
I think this is my issue, I am struggling how to coordinate all of this with a
For loop
Posted: 18 Apr 2010
by TJ
not so quick...
we are not programming yet,
we have to hash out the logic first.
1. are you evaluating this at EOB (end of bar) or intrabar?
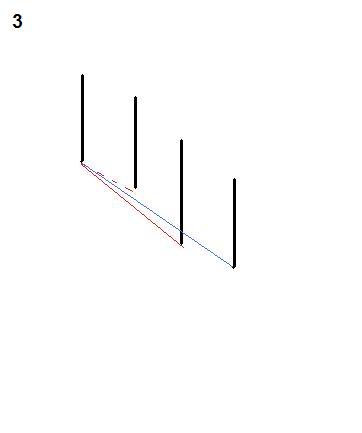
2. what do you want to do with the line in diagram 3 ?
-- erase it?
-- move it back to the prev bar?
3. what if things changed by EOB?
e.g. the TL ended up below prev bar's low at the bar's close?
what do you want to do?
-- redraw the line?
-- forget it?
Posted: 18 Apr 2010
by duration
Hi TJ,
All calculations are at end of bar, nothing update at every tick: no line is redrawn.
It is a simple: if there is two pivot from where the computer can draw a line, BUT between those two pivots there is a low that is lower than the potential trendline, then don't draw the trendline.
Many thanks,
Posted: 18 Apr 2010
by TJ
to make evaluation at EOB, use
if Barstatus = 2 then begin
Posted: 18 Apr 2010
by TJ
Hi TJ,
All calculations are at end of bar, nothing update at every tick: no line is redrawn.
It is a simple: if there is two pivot from where the computer can draw a line, BUT between those two pivots there is a low that is lower than the potential trendline, then don't draw the trendline.
Many thanks,
you don't really need a loop...
you only need to find out the TL's value at prev bar.
can you work out the formula?
Posted: 18 Apr 2010
by duration
Sure, using TL_GETVALUE_S(), it "could" be:
Code: Select all
tl_new_s( tlid, d[oPivotBar1], time_s[oPivotBar1], oPivotPrice1, d[oPivotBar2], time_s[oPivotBar2], loPivotPrice2 );


if tl_getvalue_s( tlid, d[tldi], time_s[tlid])[1] > low[1] then tl_delete[tlid);
Is it what you are asking me to do?
For the calculations with the slope etc. I cannot figure out how to synchronise everything in the right time: the getvalue and the higher thna low condition
But there is many bars between the two pivots points
It could be the one before [1], or the second one before [2] etc.
Posted: 18 Apr 2010
by TJ
Sure, using TL_GETVALUE_S(), it "could" be:
...
Is it what you are asking me to do?
For the calculations with the slope etc. I cannot figure out how to synchronise everything in the right time: the getvalue and the higher thna low condition
But there is many bars between the two pivots points It could be the one before [1], or the second one before [2] etc.
you only have to worry about the prev bar.
go draw some lines to test out my theory.
Posted: 18 Apr 2010
by TJ
Sure, using TL_GETVALUE_S(), it "could" be:
Code: Select all
tl_new_s( tlid, d[oPivotBar1], time_s[oPivotBar1], oPivotPrice1, d[oPivotBar2], time_s[oPivotBar2], loPivotPrice2 );


if tl_getvalue_s( tlid, d[tldi], time_s[tlid])[1] > low[1] then tl_delete[tlid);
For the calculations with the slope etc. I cannot figure out how to synchronise everything in the right time: the getvalue and the higher thna low condition
....
I thought we have already worked out the general formula...
you only need to make one tweak.
Posted: 18 Apr 2010
by duration
Well, I returned to the charts, and I see sometimes highs (if looking for high divergences) or lows that are higher than the trenldline, 1-2 bars after the start of the trendline.
Also, if I start plotting longer trendlines, for example from pivot with a longer "instance" (instead of 2, then 3, 4, etc.) then the trendlines often go through some high/lows in the middle of the trendline (not just or bar back or just after the start of the trendline).
Would you like some screenshots?
Posted: 18 Apr 2010
by TJ
...
Would you like some screenshots?
yes, with lines and arrows and notes pls.
Posted: 18 Apr 2010
by duration
Those screenshots are made with highs, but it is the same (inverse) story for the lows.
You might see that the trendline might go through a higher high (or a lower low if talking about lows) at anytime between the two pivot points.
Posted: 18 Apr 2010
by TJ
ok, I see what you mean...
the TL kicks in not from the beginning point, but much later in the price oscillation cycle.
in that case you do need a loop to go back in time to evaluate each and every bar since the TL beginning point.
Posted: 18 Apr 2010
by duration
Exactly. Would you know how to write such a loop? Or can you give me a hint?
Posted: 18 Apr 2010
by TJ
I would go through the EasyLanguage manual first...
there are examples inside.
try out different loops as exercises...
then give this a try.
don't just into coding yet.
write out your logic in pseudo language first,
because the computer is going to execute your instructions line-by-line,
just like a robot.
Posted: 18 Apr 2010
by duration
Well, I have been there. But I cannot figure out how to synchronise the trendline value against higher/lower than low/high test..
Posted: 18 Apr 2010
by TJ
if you can write out your logic in plain English,
I can give you a hand.
try this format:
1. write out one thought at a time,
2. write out one action per thought,
3. write out one action per line (start a new line when you have a new action)
this will help you to organize your thoughts into code-able logics.
Posted: 18 Apr 2010
by TJ
ps. don't jump into the "loop" yet.
inside the loop is your evaluation logic... this is the meat of your indicator.
the loop is just a mechanism to repeat the evaluation multiple times.
ie. work out the evaluation process first.
start with the 1st bar after the beginning point.
(or, you can work from the 1st bar before the ending point, it is the same thing)
Posted: 18 Apr 2010
by duration
Thank you so much!! I start with the markplex tutorial logic.
1. if there is two low pivot on price.
2. if the oldest pivot is higher than the youngest one.
3. then pricepivot condition is true.
4. if there is two pivot on the stochastic slow.
5. if the oldest pivot is lower than the youngest one.
6. then stochpivot condition is true.
7. if the oldest pivot on the price and the oldest pivot on the stochastic slow are within three bars of each others.
8. 7. if the youngest pivot on the price and the youngest pivot on the stochastic slow are within three bars of each others.
9. then pivotlocation condition is true.
10. if pricepivot and stochpivot and pivotlocation condition are true then begin
11. calculate how many bars there is from the youngest price pivot point to the oldest price pivot point
12. substract the value of the youngest pivot point by the oldest pivot point, and divide this result by the number of bar to get the slope value.
13. starting from the bar just after the oldest price pivot point, add incrementally the slope value to the oldest price pivot point value to each bar until the bar just before the youngest price pivot point.
14. within this loop compare the value computed at each bar with the value of the each bar low.
15. if a low is lower than this value, then stop the calculation.
16. if no low is lower than the value, then plot the trendline.
Is it clear enough?
Posted: 18 Apr 2010
by duration
Sorry, I was writing while you posted the above.
1. if there is two low pivot on price.
2. if the oldest pivot is higher than the youngest one.
3. then pricepivot condition is true.
4. if there is two pivot on the stochastic slow.
5. if the oldest pivot is lower than the youngest one.
6. then stochpivot condition is true.
7. if the oldest pivot on the price and the oldest pivot on the stochastic slow are within three bars of each others.
8. 7. if the youngest pivot on the price and the youngest pivot on the stochastic slow are within three bars of each others.
9. then pivotlocation condition is true.
10. if pricepivot and stochpivot and pivotlocation condition are true then begin
11. calculate how many bars there is from the youngest price pivot point to the oldest price pivot point
12. substract the value of the youngest pivot point by the oldest pivot point, and divide this result by the number of bar to get the slope value.
13. for the bar right after the oldest pivot point, add the slope value to the oldest pivot point value, and call it value1, and check if this value is higher than the low on the same bar.
14. for the second bar after the oldest pivot point, add the slope value to value1, and check if this value is higher than the low on the same bar.
15. for the thirdbar after the oldest pivot point, add the slope value to value2, and check if this value is higher than the low on the same bar.
16. do this until the bar just before the youngest pivot point is reached.
17. if at some point the low of the bar is lower than the value1,2,3... then stop calculations, then if not, plot a trendline.
Posted: 18 Apr 2010
by TJ
I think you've got it...
now just focus on #13 onward...
see if you can code something.
Posted: 18 Apr 2010
by duration
Ok, I will try again (actually this is the area where the problem is...)
Posted: 18 Apr 2010
by duration
Hi TJ,
This is what I have written:
Code: Select all
// http://markplex.com/tutorial26.php


Inputs : PriceL(Low),StochLength(7),SmoothingLength1(3),SmoothingLength2(3),SmoothingType(1),

     Length(20),LeftStrength(3),RightStrength(1),BarTol(3);


vars: ofastk(0),oFastD(0),oSlowk(0),oSlowD(0),oPivotPrice1(0),oPivotBar1(0),oPivotPrice2(0),oPivotBar2(0),

oPivotPrice3(0),oPivotBar3(0),oPivotPrice4(0),oPivotBar4(0),

tlslope(0), bback(0), tlvalue(0);


Value1=Stochastic(H,L,C,StochLength,SmoothingLength1,SmoothingLength2,SmoothingType,ofastk,ofastd,oslowk,oslowd);


//Determine if pivots in the price have occurred

Condition3 = Pivot(PriceL,Length,LeftStrength,RightStrength,1,-1,oPivotPrice3,oPivotBar3)<>-1;

Condition4 = Pivot(PriceL,Length,LeftStrength,RightStrength,2,-1,oPivotPrice4,oPivotBar4)<>-1;


//Determine if pivots in the stochstic have occurred

Condition1 = Pivot(oslowd,Length,LeftStrength,RightStrength,1,-1,oPivotPrice1,oPivotBar1)<>-1;

Condition2 = Pivot(oslowd,Length,LeftStrength,RightStrength,2,-1,oPivotPrice2,oPivotBar2)<>-1;


if condition3 and condition4 and condition1 and condition2

and (absvalue(oPivotbar1-oPivotBar3)<BarTol)

and (absvalue(oPivotbar2-oPivotBar4)<BarTol)

and (oPivotBar3 = RightStrength or oPivotbar1 = RightStrength)

and (oPivotPrice3<=oPivotPrice4 and oPivotPrice1>oPivotPrice2) and barstatus(1)=2 then

      begin


      value2= tl_new_S(D[oPivotBar4],Time_S[oPivotBar4],L[oPivotBar4],D[oPivotBar3],Time_s[oPivotBar3],L[oPivotBar3]);

      tl_setcolor(value2,Green);

      tl_setsize   (value2,1);


      value3= tl_new_Self_s(D[oPivotBar1],Time_S[oPivotBar1],oPivotPrice1,D[oPivotBar2],Time_s[oPivotBar2],oPivotPrice2);

      tl_setcolor(value3,Green);

      tl_setsize   (value3,1);


      tlslope = (oPivotPrice2 - oPivotPrice1) / AbsValue(oPivotbar1-oPivotBar2); //value of the slope

      for bback = oPivotBar2 - 1 downto bback = oPivotBar1 + 1 //from bar just after oPivotBar2 downto bar just before oPivotBar1

           begin

           tlvalue = oPivotPrice2 + tlvalue[bback] * tlslope; //intercept (oPivotPrice2) + value of trendline * slope

           if tlvalue > low[bback] then tl_setstyle(value2,2) else tl_setstyle(value2,3); //instead of deleting, just change style, so that it is easier to see what is plotted

           end;

      end;


Plot1(oSlowD);
But all trendlines plot either with dashes or dots irrelevant of the "low lower than tlvalue" condition
Posted: 18 Apr 2010
by TJ
you are rushing it... LOL
slow down!
focus on #13 onward only
work on a 1 bar evaluation... if it works then you can put it in a loop.
suggestion:
do not use generic variables like Condition1 or value1.
always create a meaningful name,
because you will need it when you re-visit your code in 3 months' time.
ps. except Value1=Stochastic etc., because it is only a dummy variable.
Posted: 18 Apr 2010
by duration
I am trying to check the value of the bar just before the oPivotBar3:
Code: Select all
// http://markplex.com/tutorial26.php


inputs :

	PriceL(Low),

	StochLength(7),

	SmoothingLength1(3),

	SmoothingLength2(3),

	SmoothingType(1),

	Length(20),

	LeftStrength(3),

	RightStrength(1),

	BarTol(3);


vars:

	ofastk(0),

	oFastD(0),

	oSlowk(0),

	oSlowD(0),

	oPivotPrice1(0),

	oPivotBar1(0),

	oPivotPrice2(0),

	oPivotBar2(0),

	oPivotPrice3(0),

	oPivotBar3(0),

	oPivotPrice4(0),

	oPivotBar4(0),

	tlslope(0),

	bback(0),

	tlvalue(0),

	pricepivotcondition1(false),

	pricepivotcondition2(false),

	stochpivotcondition1(false),

	stochpivotcondition2(false),

	stochvalue(0),

	tlstoch(0),

	tlprice(0);


stochvalue=Stochastic(H,L,C,StochLength,SmoothingLength1,SmoothingLength2,SmoothingType,ofastk,ofastd,oslowk,oslowd);


//Determine if pivots in the stochstic have occurred

stochpivotcondition1 = Pivot(oslowd,Length,LeftStrength,RightStrength,1,-1,oPivotPrice1,oPivotBar1)<>-1;

stochpivotcondition2 = Pivot(oslowd,Length,LeftStrength,RightStrength,2,-1,oPivotPrice2,oPivotBar2)<>-1;


//Determine if pivots in the price have occurred

pricepivotcondition1 = Pivot(PriceL,Length,LeftStrength,RightStrength,1,-1,oPivotPrice3,oPivotBar3)<>-1;

pricepivotcondition2 = Pivot(PriceL,Length,LeftStrength,RightStrength,2,-1,oPivotPrice4,oPivotBar4)<>-1;


if pricepivotcondition1 and pricepivotcondition2 and stochpivotcondition1 and stochpivotcondition2

and (absvalue(oPivotbar1-oPivotBar3)<BarTol)

and (absvalue(oPivotbar2-oPivotBar4)<BarTol)

and (oPivotBar3 = RightStrength or oPivotbar1 = RightStrength)

and (oPivotPrice3<=oPivotPrice4 and oPivotPrice1>oPivotPrice2) and barstatus(1)=2 then

      begin


      tlprice= tl_new_S(D[oPivotBar4],Time_S[oPivotBar4],L[oPivotBar4],D[oPivotBar3],Time_s[oPivotBar3],L[oPivotBar3]);

      tl_setcolor(tlstoch,Red);

      tl_setsize   (tlstoch,1);


      tlstoch= tl_new_Self_s(D[oPivotBar1],Time_S[oPivotBar1],oPivotPrice1,D[oPivotBar2],Time_s[oPivotBar2],oPivotPrice2);

      tl_setcolor(tlprice,Green);

      tl_setsize   (tlprice,1);


      tlslope = (oPivotPrice3 - oPivotPrice4) / AbsValue(oPivotbar3-oPivotBar4); //value of the slope

      tlvalue = oPivotPrice4 * (AbsValue(oPivotBar3 - oPivotBar4)-1) * tlslope; //the -1 is for the bar just before the oPivotBar3

      if tlvalue > low[oPivotBar3+1] then tl_setstyle(tlprice,2) else tl_setstyle(tlprice,3); //+1 for bar just before oPivotBar3


      {for bback = oPivotBar4 - 1 downto bback = oPivotBar3 + 1 //from bar just after oPivotBar4 downto bar just before oPivotBar3

           begin

           tlvalue = oPivotPrice4 + tlvalue[bback] * tlslope; //intercept (oPivotPrice4) + value of trendline * slope

           if tlvalue[bback] > low[bback] then tl_setstyle(tlprice,2) else tl_setstyle(tlprice,3); //instead of deleting, just change style, so that it is easier to see what is plotted

           end;}

      end;


Plot1(oSlowD);
It does not work
but am I on the right way?
Posted: 18 Apr 2010
by TJ
I am trying to check the value of the bar just before the oPivotBar3:
...
It does not work
but am I on the right way?
I can't see where #13 starts...
I am not concerned with the complete code...
I am only interested in only a small section of the logic.
ie #13...
because without this logic, the rest is useless...
Posted: 18 Apr 2010
by TJ
13. for the bar right after the oldest pivot point, add the slope value to the oldest pivot point value, and call it value1, and check if this value is higher than the low on the same bar.
this is a loooooong winded sentence...
with multiple actions in the same line.
if you are going to get anywhere,
you have to break it down
into chewable sizes.
ps. see how I write?
short sentence,
one thought at a time
one thought per line...
Posted: 19 Apr 2010
by duration
Oh I see (thanks for your patience!). Is the below ok?
tlslope = (oPivotPrice3 - oPivotPrice4) / AbsValue(oPivotbar3-oPivotBar4);
value1 = oPivotPrice4*tlslope;
if value1 >= low[oPivotBar4-1] then then tl_setstyle(tlprice,2) else tl_setstyle(tlprice,3);
Posted: 19 Apr 2010
by TJ
Oh I see (thanks for your patience!). Is the below ok?
tlslope = (oPivotPrice3 - oPivotPrice4) / AbsValue(oPivotbar3-oPivotBar4);
value1 = oPivotPrice4*tlslope;
if value1 >= low[oPivotBar4-1] then then tl_setstyle(tlprice,2) else tl_setstyle(tlprice,3);
Well, as long as you put in your fair share... I can help you out.
otherwise I will have to refer you to Bruce DeVault. LOL
let's go back to this diagram:

the line is drawn with this statement:
tl_new_S( Date[oPivotBar4], Time_S[oPivotBar4], Low[oPivotBar4], Date[oPivotBar3], Time_s[oPivotBar3], Low[oPivotBar3]);
can you see the TL's coordinates?
Posted: 19 Apr 2010
by duration

Yes :
oPivotBar4 = 3 and oPivotPrice4 = 10
oPivotBar3 = 0 and oPivotPrice4 = 7
Posted: 19 Apr 2010
by TJ
Yes :
oPivotBar4 = 3 and oPivotPrice4 = 10
oPivotBar3 = 0 and oPivotPrice4 = 7
you are on the right track... but you need to be a little bit more specific.
beginning price = Low[oPivotBar4]
ending price = Low[oPivotBar3]
.
Posted: 19 Apr 2010
by TJ
I hope this has provided you with plenty of leads to go on.
I will pick this up again tomorrow.
Enjoy!
ps. I can't stand those value1.
Posted: 19 Apr 2010
by duration
Thanks for all your help, hopefully I will write some positive news tomorrow!
Posted: 19 Apr 2010
by duration
TJ,
I am getting crazy. I could not get anything done with breaking down the logic and doing it line by line, and I have been breaking my head for like 8 hours on this...
The first problem is: if I print the oPivotBarX values, I get values like 8-10 (oPivotBar4) and 1-2 (oPivotBar3), but the
For loop only work with
DownTo, no matter I write:
Code: Select all
for bback = oPivotBar3 + 1 to bback = oPivotBar4 - 1
or
Code: Select all
for bback = oPivotBar4 - 1 to bback = oPivotBar3 + 1
The second problem is that if I print value1, it seems that the loop only works for 3 bars, not matter oPivotBar4 is 10 and oPivotBar3 is 1.....
The third problem is that, I have tried every combination and I don't know how to go further, I am completely stuck
Code: Select all
// http://markplex.com/tutorial26.php


inputs :

	PriceL(Low),

	StochLength(7),

	SmoothingLength1(3),

	SmoothingLength2(3),

	SmoothingType(1),

	Length(20),

	LeftStrength(3),

	RightStrength(1),

	BarTol(3);


vars:

	ofastk(0),

	oFastD(0),

	oSlowk(0),

	oSlowD(0),

	oPivotPrice1(0),

	oPivotBar1(0),

	oPivotPrice2(0),

	oPivotBar2(0),

	oPivotPrice3(0),

	oPivotBar3(0),

	oPivotPrice4(0),

	oPivotBar4(0),

	tlslope(0),

	bback(0),

	tlvalue(0),

	pricepivotcondition1(false),

	pricepivotcondition2(false),

	stochpivotcondition1(false),

	stochpivotcondition2(false),

	stochvalue(0),

	tlstoch(0),

	tlprice(0)

        tlcounter(0),

tldistance(0);


stochvalue=Stochastic(H,L,C,StochLength,SmoothingLength1,SmoothingLength2,SmoothingType,ofastk,ofastd,oslowk,oslowd);


//Determine if pivots in the stochstic have occurred

stochpivotcondition1 = Pivot(oslowd,Length,LeftStrength,RightStrength,1,-1,oPivotPrice1,oPivotBar1)<>-1;

stochpivotcondition2 = Pivot(oslowd,Length,LeftStrength,RightStrength,2,-1,oPivotPrice2,oPivotBar2)<>-1;


//Determine if pivots in the price have occurred

pricepivotcondition1 = Pivot(PriceL,Length,LeftStrength,RightStrength,1,-1,oPivotPrice3,oPivotBar3)<>-1;

pricepivotcondition2 = Pivot(PriceL,Length,LeftStrength,RightStrength,2,-1,oPivotPrice4,oPivotBar4)<>-1;


if pricepivotcondition1 and pricepivotcondition2 and stochpivotcondition1 and stochpivotcondition2

and (absvalue(oPivotbar1-oPivotBar3)<BarTol)

and (absvalue(oPivotbar2-oPivotBar4)<BarTol)

and (oPivotBar3 = RightStrength or oPivotbar1 = RightStrength)

and (oPivotPrice3<=oPivotPrice4 and oPivotPrice1>oPivotPrice2) and barstatus(1)=2 then

      begin


      tlprice= tl_new_S(D[oPivotBar4],Time_S[oPivotBar4],L[oPivotBar4],D[oPivotBar3],Time_s[oPivotBar3],L[oPivotBar3]);

      tl_setcolor(tlstoch,Red);

      tl_setsize   (tlstoch,1);


      tlstoch= tl_new_Self_s(D[oPivotBar1],Time_S[oPivotBar1],oPivotPrice1,D[oPivotBar2],Time_s[oPivotBar2],oPivotPrice2);

      tl_setcolor(tlprice,Green);

      tl_setsize   (tlprice,1);


      tldistance = absvalue(oPivotBar3-oPivotBar4);

      //print(opivotbar2,";",opivotbar4,";",opivotbar1,";",opivotbar3,";",tldistance);

      tlslope = (oPivotPrice3 - oPivotPrice4) / AbsValue(oPivotbar3-oPivotBar4); //value of the slope

      for bback = oPivotBar4 - 1 downto bback = oPivotBar3 + 1

           begin

           tlcounter = oPivotPrice3 - (tlslope*bback);

           //print(date:7:0,";",time:4:0,";",bback,";",tlslope:0:6,";",value1:0:6);

           if tlcounter[bback] > low[bback] then tl_setstyle(tlprice,3) else tl_setstyle(tlprice,2);

           end;

      end;


Plot1(oSlowD);
The
Prints are still in the code above if you or anybody want to have a look..
At least I know the print function inside and out now!
Posted: 19 Apr 2010
by TJ
Hello again !
Would you mind checking if the below is conceptually correct? I am trying to tell powerlanguage the values of each trendline point from barnumber 40 to 50, and I am not sure if a loop statement can achieve this.
Code: Select all
variables:

     PointA_y( 0 ),

     PointA_x( 0 ),

     PointB_y( 0 ),

     PointB_x( 0 ),

     Slope_m( 0 ),

     TrendLine_AB( 0 ),

     plotcondition( false ),

     noplotcondition( false );


PointA_y = oPivotPrice2 ; //1.5210

PointA_x = oPivotBar2 ; //40


PointB_y = oPivotPrice1 ; //1.5230

PointB_x = oPivotBar1 ; // 50


Slope_m = ( PointB_y - PointA_y ) / ( PointB_x - PointA_x) ; //0.0002


For CurrentBar = PointA_x to CurrentBar = PointB_x

     Begin

     TrendLine_AB = slope_m * PointA_y ;

     If Low < TrendLine_AB then noplotcondition = true;

     If Low >= Trendline_AB then plotcondition = true;

     End;
Many thanks,
can you re-do the coordinates in this section?
I am only interested in the coordinates only at this moment...
we have to take the steps one step at a time.
rushing will only get us headaches.
Posted: 19 Apr 2010
by duration
Sure!
Here you are:
Code: Select all
Variables:

     PointA_Y( 0 ),

     PointA_X( 0 ),

     PointB_Y( 0 ),

     PointB_X( 0 ),

     Slope_M( 0 ),

     TrendLine_AB( 0 ),

     PlotCondition( false ),

     NoPlotCondition( false );


PointA_Y = Low[oPivotBar4] ;

PointA_x = oPivotBar4 ;


PointB_y = Low[oPivotPrice3] ;

PointB_x = oPivotBar3 ;


Slope_M = ( PointB_Y - PointA_Y ) / AbsValue( PointB_X - PointA_X ) ;
Posted: 19 Apr 2010
by TJ
Sure!
Here you are:
Code: Select all
Variables:

     PointA_Y( 0 ),

     PointA_X( 0 ),

     PointB_Y( 0 ),

     PointB_X( 0 ),

     Slope_M( 0 ),

     TrendLine_AB( 0 ),

     PlotCondition( false ),

     NoPlotCondition( false );


PointA_Y = Low[oPivotBar4] ;

PointA_x = oPivotBar4 ;


PointB_y = Low[oPivotPrice3] ;

PointB_x = oPivotBar3 ;


Slope_M = ( PointB_Y - PointA_Y ) / AbsValue( PointB_X - PointA_X ) ;
... you have to be more careful
... you have to check everything in detail,
because you are instructing the computer to perform an operation.
garbage instruction will net garbage results.
can you plug your
Slope_M formula with these values and check the result?
Posted: 19 Apr 2010
by duration
Sure:
( 7 - 10 ) / ABS( 0 - 3 )
-3 / 3 = -1
Slope_M = -1
It means that for a move from x = 3 to x = 2, y decrease of 1.
I read your graph from left to right, AY = 10, AX = 3, BY = 7, BX = 0.
Posted: 19 Apr 2010
by TJ
Sure:
( 7 - 10 ) / ABS( 0 - 3 )
-3 / 3 = -1
Slope_M = -1
It means that for a move from x = 3 to x = 2, y decrease of 1.
I read your graph from left to right, AY = 10, AX = 3, BY = 7, BX = 0.
hah... my mind slipped.
you must be wondering what the heck I am talking about.
I am the one who needs to be more careful. LOL
Yes, your numbers are correct.
Posted: 19 Apr 2010
by TJ
TJ,
I am getting crazy. I could not get anything done with breaking down the logic and doing it line by line, and I have been breaking my head for like 8 hours on this...
The first problem is: if I print the oPivotBarX values, I get values like 8-10 (oPivotBar4) and 1-2 (oPivotBar3), but the
For loop only work with
DownTo, no matter I write:
Code: Select all
for bback = oPivotBar3 + 1 to bback = oPivotBar4 - 1
or
Code: Select all
for bback = oPivotBar4 - 1 to bback = oPivotBar3 + 1
The second problem is that if I print value1, it seems that the loop only works for 3 bars, not matter oPivotBar4 is 10 and oPivotBar3 is 1.....
The third problem is that, I have tried every combination and I don't know how to go further, I am completely stuck
...
you need to study the loop a bit more...
there are examples in the manual as well as in the dictionary.
can you post the complete loop?
Posted: 19 Apr 2010
by duration
LOL no worries
The loop is as follow:
tlslope = (oPivotPrice3 - oPivotPrice4) / AbsValue(oPivotbar3-oPivotBar4); //value of the slope
for bback = oPivotBar4 - 1 downto bback = oPivotBar3 + 1
begin
tlcounter = oPivotPrice3 - (tlslope*bback);
//print(date:7:0,";",time:4:0,";",bback,";",tlslope:0:6,";",value1:0:6);
if tlcounter[bback] > low[bback] then tl_setstyle(tlprice,3) else tl_setstyle(tlprice,2);
end;
It is part of the 11:28 am post above.
Posted: 19 Apr 2010
by TJ
watistis ?
Code: Select all
tlslope = (oPivotPrice3 - oPivotPrice4) / AbsValue(oPivotbar3-oPivotBar4); //value of the slope
Posted: 19 Apr 2010
by duration
It must be something wrong.
Is this better?
Code: Select all
tlslope = (Low[oPivotBar3] - Low[oPivotBar4]) / AbsValue(oPivotbar3-oPivotBar4);
Posted: 19 Apr 2010
by TJ
much better...
now you have to get the loop components...
some reading of the manual/dictionary is required.
Posted: 19 Apr 2010
by duration
Well, a loop has a
control variable, which is
bback in this case.
The loop should look at every bar between the bar before oPivotBar3 and the Bar after oPivotBar4.
The value of the control variable should then be the bar before oPivotBar3 and the Bar after oPivotBar4.
It should give:
Code: Select all
For bback = oPivotBar3 +1 to oPivotbar4 -1

     begin

     end;
Is this correct?
Posted: 19 Apr 2010
by TJ
yes, that's correct.
try this...
Code: Select all
For bback = oPivotBar3 +1 to oPivotbar4 -1

     begin

          plot99( h, "Loop test");

     end;
set the plot to a cross, and see where the plots appear.
this step is to test your evaluation process...
to see which bars are checked.
Posted: 19 Apr 2010
by TJ
ps. insert the code after this line:
tlprice= tl_new_S(
Posted: 19 Apr 2010
by duration
That is a useful tip!
Better than Print!
If you look at the screenshot, it shows that the loop does not look in the bar it should look in.
Also according to the screenshot, the no bar is either dashed or dotted anymore.
Is there a problem with the control variable values?
Posted: 19 Apr 2010
by TJ
now you know what I meant by...
It can be done; it is high school math, not rocket science... but it does take time.
This is not a one or two keyword operation.
It will take time to code the logic and the process..
I am glad you are still having fun.

Posted: 19 Apr 2010
by duration
Indeed!
But how come the loop does look at the right bars? The control variables values are clear... and I have tried all the combinations, it does not want plot the crosses right under the pivot point...
Posted: 19 Apr 2010
by TJ
I haven't had time to try the code,
I will take a look at it later...
Posted: 19 Apr 2010
by duration
Thanks, I am trying every possible thing right now as well..
Posted: 19 Apr 2010
by duration
Please find below the version with the loop, to make your life easier!
Code: Select all
// http://markplex.com/tutorial26.php


inputs :

	PriceL(Low),

	StochLength(7),

	SmoothingLength1(3),

	SmoothingLength2(3),

	SmoothingType(1),

	Length(20),

	LeftStrength(3),

	RightStrength(1),

	BarTol(3);


vars:

	ofastk(0),

	oFastD(0),

	oSlowk(0),

	oSlowD(0),

	oPivotPrice1(0),

	oPivotBar1(0),

	oPivotPrice2(0),

	oPivotBar2(0),

	oPivotPrice3(0),

	oPivotBar3(0),

	oPivotPrice4(0),

	oPivotBar4(0),

	tlslope(0),

	bback(0),

	tlvalue(0),

	pricepivotcondition1(false),

	pricepivotcondition2(false),

	stochpivotcondition1(false),

	stochpivotcondition2(false),

	stochvalue(0),

	tlstoch(0),

	tlprice(0),

	tldistance(0);


stochvalue=Stochastic(H,L,C,StochLength,SmoothingLength1,SmoothingLength2,SmoothingType,ofastk,ofastd,oslowk,oslowd);


//Determine if pivots in the stochstic have occurred

stochpivotcondition1 = Pivot(oslowd,Length,LeftStrength,RightStrength,1,-1,oPivotPrice1,oPivotBar1)<>-1;

stochpivotcondition2 = Pivot(oslowd,Length,LeftStrength,RightStrength,2,-1,oPivotPrice2,oPivotBar2)<>-1;


//Determine if pivots in the price have occurred

pricepivotcondition1 = Pivot(PriceL,Length,LeftStrength,RightStrength,1,-1,oPivotPrice3,oPivotBar3)<>-1;

pricepivotcondition2 = Pivot(PriceL,Length,LeftStrength,RightStrength,2,-1,oPivotPrice4,oPivotBar4)<>-1;


if pricepivotcondition1 and pricepivotcondition2 and stochpivotcondition1 and stochpivotcondition2

and (absvalue(oPivotbar1-oPivotBar3)<BarTol)

and (absvalue(oPivotbar2-oPivotBar4)<BarTol)

and (oPivotBar3 = RightStrength or oPivotbar1 = RightStrength)

and (oPivotPrice3<=oPivotPrice4 and oPivotPrice1>oPivotPrice2) and barstatus(1)=2 then

      begin


      tldistance = absvalue(oPivotBar3-oPivotBar4);

      tlprice=tl_new_S(D[oPivotBar4],Time_S[oPivotBar4],L[oPivotBar4],D[oPivotBar3],Time_s[oPivotBar3],L[oPivotBar3]);

      tl_setcolor(tlprice,yellow);

      tl_setsize(tlprice,1);

      for bback = oPivotBar3+1 to oPivotBar4-1

      begin

      plot99(h,"Loop Test");

      end;


      tlstoch= tl_new_Self_s(D[oPivotBar1],Time_S[oPivotBar1],oPivotPrice1,D[oPivotBar2],Time_s[oPivotBar2],oPivotPrice2);

      tl_setcolor(tlstoch,Green);

      tl_setsize   (tlstoch,1);

      end;


      Plot1(oSlowD);
I have tryinng to tweak the inputs, to use tldistance etc. in the loop for 2 hours, but no luck
If anyone else want also to have a look, you are all welcome!
Posted: 19 Apr 2010
by TJ
give this a try:
Posted: 19 Apr 2010
by duration
It works! Exactly where it should be!
Now I need to calculate the trendline from oPivotBar4-1.
It is going to be easier to check the calculation with the plot in the loop.
Posted: 19 Apr 2010
by duration
I got the trendline values!
But now I am struggling to place in the loop:
Code: Select all
if tlvalue[bback] > low[bback] then tl_setstyle(tlprice, 3) else tl_setstyle(tlprice, 2);
All the trendlines use style 2 at the moment.
I think it is because the loop does not stop as soon as the tlvalue > low is true.
Is there any way to stop the loop as soon as the condition is true?
Posted: 19 Apr 2010
by TJ
Posted: 19 Apr 2010
by duration
Actually, the proper calculation for the trendline seems to be:
Code: Select all
tlvalue = low[oPivotBar3] - (tlslope*(bback-RightStrength));