I have until recently been using MC64 Beta2 (version 8.0.5203.202) with only minor problems, but recently upgraded to the MC64 release version on one of my 5 PCs. Unfortunately I discovered an easily reproducible problem in displaying overlaid plots during online operation in MC64release version that was not present Beta2.
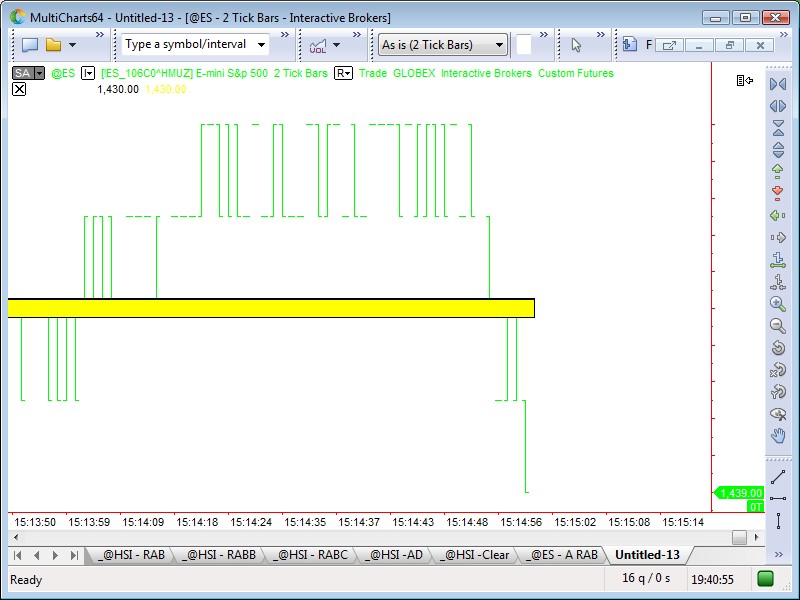
This is illustrated in the attached png screen shots, which show two sequences of large "left tick" plots, one yellow overlaying a slightly larger black. The intent of this simplified example is to display a yellow bar with a black border; variations of this are used extensively in my production indicators. The PNG labeled Beta2 or offline shows the correct display, which Beta2 achieves both offline and online. The PNG labeled MC64Release shows that confusing gaps appear in the yellow overlay during online use with MC64Release. You can readily reproduce this problem during market hours with the workspace and indicator also enclosed.
After seeing this problem I uninstalled the release version (though I would of course prefer to use it if possible) and re-installed the Beta2. However, the Beta2 (on the machine where the Release version was installed only...which unfortunately is my primary machine) is now corrupted and has exactly the same problem. My other machines which run Beta2 but where MC64 Release was never installed continue to display this type of indicator correctly, both online and offline.
Please advise how to correct this problem as soon as possible as it makes my indicators essentially unreadable during market hours, and I cannot correct it by reinstalling Beta2, since this changed is somehow "sticky" and is not removed when the MC64release version is uninstalled.
Plot Overlay Problem in MC64 Release Version
Plot Overlay Problem in MC64 Release Version
- Attachments
-
- PlotOverlay.zip
- (65.17 KiB) Downloaded 130 times
-
TJ

- Posts: 7742
- Joined: 29 Aug 2006
- Location: Global Citizen
- Has thanked: 1033 times
- Been thanked: 2222 times
Re: Plot Overlay Problem in MC64 Release Version
Can you check one setting:
Format Window > X - Time Scale > Settings
Please see if the Bar Spacing are the same pixels.
Format Window > X - Time Scale > Settings
Please see if the Bar Spacing are the same pixels.
-
TJ
- Posts: 7742
- Joined: 29 Aug 2006
- Location: Global Citizen
- Has thanked: 1033 times
- Been thanked: 2222 times
Re: Plot Overlay Problem in MC64 Release Version
I am using MultiCharts64 Version 8.0 Release (Build 5622)
Here is my screenshot. It looks ok on my computer.
I zoomed right in, then zoomed right out, and zoomed right in again. The chart still looked intact.
Maybe others can give it a try and report their findings.
Here is my screenshot. It looks ok on my computer.
I zoomed right in, then zoomed right out, and zoomed right in again. The chart still looked intact.
Maybe others can give it a try and report their findings.
- Attachments
-
- 2012-09-12 19.4006.jpg
- (77.94 KiB) Downloaded 442 times
Re: Plot Overlay Problem in MC64 Release Version
The problem only appears when you run the chart online for a few minutes during active trading without modifying it or clicking on it. As the chart scrolls to accommodate new data on the right, the gaps appear on the left.
-
TJ
- Posts: 7742
- Joined: 29 Aug 2006
- Location: Global Citizen
- Has thanked: 1033 times
- Been thanked: 2222 times
Re: Plot Overlay Problem in MC64 Release Version
Ok I see it now.The problem only appears when you run the chart online for a few minutes during active trading without modifying it or clicking on it. As the chart scrolls to accommodate new data on the right, the gaps appear on the left.
-
Henry MultiСharts

- Posts: 9165
- Joined: 25 Aug 2011
- Has thanked: 1264 times
- Been thanked: 2957 times
Re: Plot Overlay Problem in MC64 Release Version
trader39, please go to File tab->Preferences->Appearance->enable the option "Improve visual appearance of drawing tools". Then close Multicharts, make sure all processes are finished. Then start MC and open your workspace.