Hi
How can I display the average between the bid and ask instead of the ask. Also, why are there gaps all over my candlestick charts even in the 5m and 1m timeframes? The open and close of a candle based on time is the exact same moment so they shouldn't vary and the gaps make the chart a lot harder to read in my opinion.
My feed is LMAX if that makes any difference.
Thanks
How to display average bid and ask
-
Andrew MultiCharts

- Posts: 1587
- Joined: 11 Oct 2011
- Has thanked: 931 times
- Been thanked: 559 times
Re: How to display average bid and ask
Hello Agro,
Let me address your questions in the order:
Let me address your questions in the order:
- Please make sure your MultiCharts is latest 8.5 Beta 2, since there has been improvements in terms of LMAX API and its integration in MultiCharts.
- Read this article in order to learn more about the nature of historical gaps in MultiCharts and how they can be filled.
- MultiCharts works with 3 types of data: trades, asks and bids. If you want to see average between asks and bids, you should plot asks and bids as 2 separate data series and apply a custom indicator to see their average plot. The prebuilt "Spread - Diff" and "Spread - Ratio" are the examples of what i am talking about.
Re: How to display average bid and ask
Hello, thanks for the reply.
Concerning the average between the bid and the ask question the studies you directed me to are not what I want. I want the actual chart to be plotted using the average instead of the ask, bid or trade. How can this be done? I have an EA for mt4 that will do this but because mt4 doesn't have historical data for both the bid and the ask I can't get a historical average chart. I guess because muticharts has historical data for both the bid and the ask I should be able to achieve what I am looking to achieve.
Thanks
-
Andrew MultiCharts
- Posts: 1587
- Joined: 11 Oct 2011
- Has thanked: 931 times
- Been thanked: 559 times
Re: How to display average bid and ask
As i have mentioned previously, MultiCharts works only with asks, bids and trades directly, so these values are plotted as they are, not average. What you are looking is a new chart type that is not yet implemented in the software. Please leave us such feature request.
-
JoshM

- Posts: 2195
- Joined: 20 May 2011
- Location: The Netherlands
- Has thanked: 1544 times
- Been thanked: 1565 times
- Contact:
Re: How to display average bid and ask
This can be done by:I want the actual chart to be plotted using the average instead of the ask, bid or trade. How can this be done? I have an EA for mt4 that will do this but because mt4 doesn't have historical data for both the bid and the ask I can't get a historical average chart. I guess because muticharts has historical data for both the bid and the ask I should be able to achieve what I am looking to achieve.
* Setting the QuoteManager to collect Bid and Ask prices (i.e., Connect Symbol)
* Keep the QuoteManager running 24/5 to collect all data
* Make a new chart with Bid as Data 1 and Ask as Data 2
* Create an indicator which calculates the High, Low, Open, Close values for each bar by averaging data series 1 & 2
* Change the settings of this indicator so that Candlesticks are produced
As I realize now, this is the same as Andrew mentioned in point 3 of his first message in this thread. Well, I guess it's now even more clear.
-
Andrew MultiCharts
- Posts: 1587
- Joined: 11 Oct 2011
- Has thanked: 931 times
- Been thanked: 559 times
Re: How to display average bid and ask
Thank you JoshM, you are correct. Just to make sure it is clear for everyone: this way is only for displaying the desired data series, not for base your other scripts on it.* Setting the QuoteManager to collect Bid and Ask prices (i.e., Connect Symbol)
* Keep the QuoteManager running 24/5 to collect all data
* Make a new chart with Bid as Data 1 and Ask as Data 2
* Create an indicator which calculates the High, Low, Open, Close values for each bar by averaging data series 1 & 2
* Change the settings of this indicator so that Candlesticks are produced

Re: How to display average bid and ask
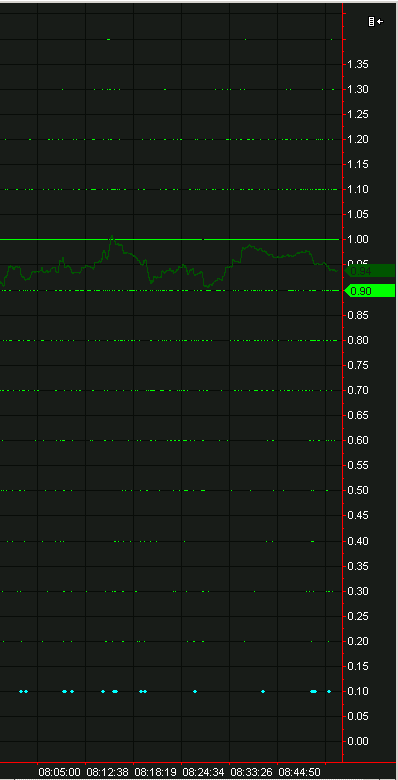
Here's what I use:
Pull up a 1 tick chart and apply this indicator. I remove the plotting of the data and make this a small window next to my trade window.
Pull up a 1 tick chart and apply this indicator. I remove the plotting of the data and make this a small window next to my trade window.
Code: Select all
Inputs:

	SMALen (200)  ;


variables:

	vAsk ( 0 ),

	vBid ( 0 ),

	vSpread (0),

	vSMA( 0 ),

	vmaxSpread (0),

	vFilename (""),

	vOutputStr (""),

	cb(0) ;


vAsk = Insideask ;

vBid = Insidebid ;

vSpread = ( vAsk - vBid ) / 10 points ;

vmaxSpread = Maxlist ( vmaxSpread, vSpread) ;

vSMA = Average ( vSpread , SMALen ) ;


Plot1( vSpread , "Spread", green ) ;

Plot2( vSMA, "Avg", darkgreen ) ;

Plot3( vmaxSpread , "Max", red ) ;


if vspread <= .1 then begin

	setplotwidth( 1, 3 ) ;

	setplotcolor( 1, cyan ) ;

end ;- Attachments
-
- 2013-02-01_0902.png
- (16.88 KiB) Downloaded 479 times