power_line = AddPlot(new PlotAttributes("Power", EPlotShapes.Histogram, Color.Cyan));
Now I want to display the value (in percentage) upon the bar of the histogram. How can I do it?
Thanks first.
about setting of plot [SOLVED]
-
Henry MultiСharts

- Posts: 9165
- Joined: 25 Aug 2011
- Has thanked: 1264 times
- Been thanked: 2957 times
-
viresearch

- Posts: 12
- Joined: 21 Mar 2013
Re: about setting of plot
posele=posele*100;
posele=Math.Round(posele, 1);
ChartPoint top = new ChartPoint(Bars.TimeValue, Bars.HighValue);
ITextObject textObj = DrwText.Create(top, posele.ToString());
textObj.VStyle = ETextStyleV.Above;
I use above codes to display the number. It displays in the instrument. But I want it to be displayed in the indicator (above the histogram). So I think I need to set ChartPoint(Bars.TimeValue, Bars.HighValue).
How can I let the text displayed in the indicator?
-
Henry MultiСharts
- Posts: 9165
- Joined: 25 Aug 2011
- Has thanked: 1264 times
- Been thanked: 2957 times
Re: about setting of plot
You need to use a different constructor:
Code: Select all
ITextObject textObj = DrwText.Create(top, posele.ToString(), true);-
viresearch
- Posts: 12
- Joined: 21 Mar 2013
Re: about setting of plot
You may create an indicator and try following,
posele=Bars.High[0];
posele=posele*100;
posele=Math.Round(posele, 1);
ChartPoint top = new ChartPoint(Bars.TimeValue, Bars.HighValue);
ITextObject textObj = DrwText.Create(top, posele.ToString(), true);
textObj.VStyle = ETextStyleV.Above;
I try the above codes. But in the indicator, no number is displayed above the histograms.
-
Henry MultiСharts
- Posts: 9165
- Joined: 25 Aug 2011
- Has thanked: 1264 times
- Been thanked: 2957 times
Re: about setting of plot
This script will plot the text on Bars.HighValue. Do you expect it on this price value on your histogram plot? Please check the price value you are using to plot the text.
-
viresearch
- Posts: 12
- Joined: 21 Mar 2013
Re: about setting of plot
I want the number to be displayed on the top of histogram in the indicator. How can I achieve it? The above setting can't let the number displayed.
-
Henry MultiСharts
- Posts: 9165
- Joined: 25 Aug 2011
- Has thanked: 1264 times
- Been thanked: 2957 times
Re: about setting of plot
Which value does your indicator plot? You need to use the same value as text location.
Please go to Format->Drawings->Format drawing->Properties to check where your drawings are currently plotted.
Everything works as expected on my end:
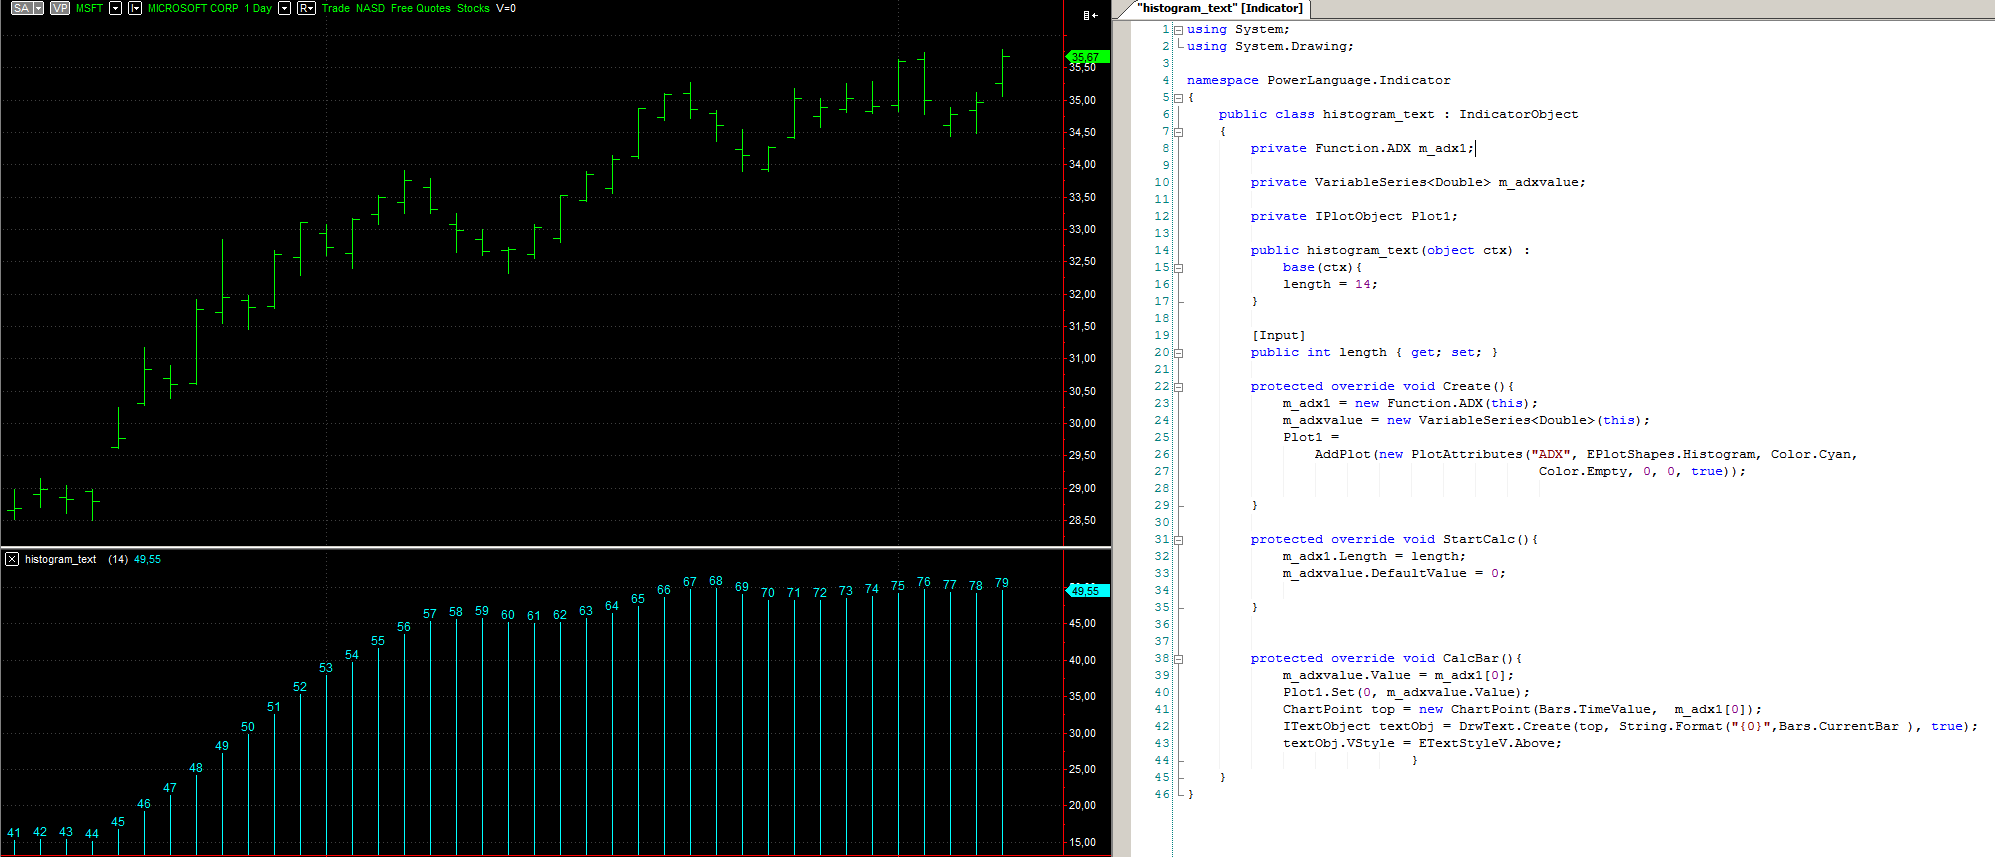
Please go to Format->Drawings->Format drawing->Properties to check where your drawings are currently plotted.
Everything works as expected on my end:
Code: Select all
m_adxvalue.Value = m_adx1[0];

Plot1.Set(0, m_adxvalue.Value);

ChartPoint top = new ChartPoint(Bars.TimeValue,  m_adx1[0]);

ITextObject textObj = DrwText.Create(top, String.Format("{0}",Bars.CurrentBar ), true);

textObj.VStyle = ETextStyleV.Above;- Attachments
-
- histogram_text.png
- (89.52 KiB) Downloaded 999 times
-
viresearch
- Posts: 12
- Joined: 21 Mar 2013
Re: about setting of plot
Based on the example, I build an indicator in the attachment. You may try it, and I still can't let the number displayed on the histogram.
Sorry for this question to take your time.
Sorry for this question to take your time.
- Attachments
-
- atest.pln
- (1.46 KiB) Downloaded 494 times
-
Henry MultiСharts
- Posts: 9165
- Joined: 25 Aug 2011
- Has thanked: 1264 times
- Been thanked: 2957 times
Re: about setting of plot [SOLVED]
Try this one.
- Attachments
-
- atest_1.pln
- (1.46 KiB) Downloaded 498 times