Why is that trendline being plotted as dotted when I specified as solid?
trendline is being plotted as dotted [SOLVED]
-
arnie

- Posts: 1594
- Joined: 11 Feb 2009
- Location: Portugal
- Has thanked: 481 times
- Been thanked: 514 times
trendline is being plotted as dotted
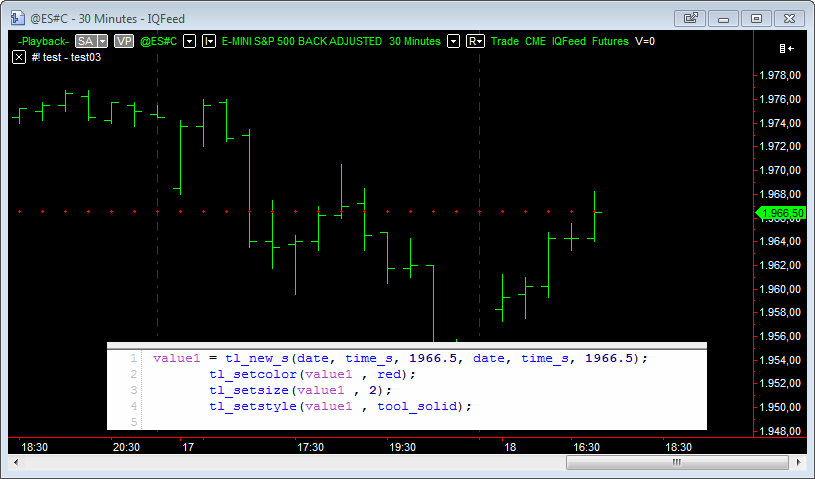
What am I missing?
Why is that trendline being plotted as dotted when I specified as solid?
Why is that trendline being plotted as dotted when I specified as solid?
- Attachments
-
- tendline.png
- (29.5 KiB) Downloaded 583 times
-
TJ

- Posts: 7743
- Joined: 29 Aug 2006
- Location: Global Citizen
- Has thanked: 1033 times
- Been thanked: 2222 times
Re: trendline is being plotted as dotted
With your programming experience,What am I missing?
Why is that trendline being plotted as dotted when I specified as solid?
why would you still use generic variable name (value1) as ID?
-
arnie
- Posts: 1594
- Joined: 11 Feb 2009
- Location: Portugal
- Has thanked: 481 times
- Been thanked: 514 times
Re: trendline is being plotted as dotted
Not wanting to talk about my programming experience...With your programming experience,
why would you still use generic variable name (value1) as ID?
The generic variable serves just as an example.
But here something interesting, if you extend the trendline to the right it becomes solid (tool_solid)
Code: Select all
variable:

	tlID  (-1);


tlID = tl_new_s(date, time_s, 1966.5, date, time_s, 1966.5);

	tl_setcolor(tlID, red);

	tl_setsize(tlID, 2);

	tl_setstyle(tlID, tool_solid);

	tl_setextright(tlID, true);
or dotted (tool_dotted)
or dashed (tool_dashed)
but when you comment the right extention the line becomes sort of dotted again
Code: Select all
variable:

	tlID  (-1);


tlID = tl_new_s(date, time_s, 1966.5, date, time_s, 1966.5);

	tl_setcolor(tlID, red);

	tl_setsize(tlID, 2);

	tl_setstyle(tlID, tool_dashed);

	//tl_setextright(tlID, true);
Is this a bug?
I find this odd since all my studies with trendlines continues to plot fine. Only when I write a new one this happens.
- Attachments
-
- tendline05.png
- (21.47 KiB) Downloaded 379 times
-
- tendline04.png
- (21.52 KiB) Downloaded 381 times
-
- tendline03.png
- (21.49 KiB) Downloaded 377 times
-
- tendline02.png
- (21.44 KiB) Downloaded 376 times
Re: trendline is being plotted as dotted [SOLVED]
Hi, I am afraid you are painting a new trendline with each bar, so it looks like a dot. The problem is your starting date/time = ending date/time, so it just coincidently looks like a dot because it covers a single point in the time rather than some period. You can see https://www.multicharts.com/trading-sof ... p/TL_New_s to see what arguments you need to supply.What am I missing?
Why is that trendline being plotted as dotted when I specified as solid?