Help with trend lines

Questions about MultiCharts and user contributed studies.
jayrenard
Posts: 7
Joined: 16 Dec 2013

Help with trend lines

Postby jayrenard » 14 Sep 2014

Hello Multicharts community,

I am trying to add a trend line to the pivot indicator that would extend to the right until a candle closes above that trend line. TL would then stop expanding but stay on the chart. I have managed to create the trend line and extend it to the right but I can t get it to stop when price close above.

here is my simple code for now. I would really appreciate if somebody would help. Thanks

Code: Select all

inputs: Price( High ), LeftStrength( 3 ), RightStrength( 3 ) ;

variable : HighTL(0);


condition1 = PivotHighVSBar( 1, Price, LeftStrength, RightStrength, RightStrength + 1 ) <> -1 ;
if condition1
then
begin
[b] HighTL= TL_New(Date[RightStrength], Time[RightStrength], High[RightStrength], Date[RightStrength], Time[RightStrength], High[RightStrength]);
TL_SetExtRight(HighTL, True);[/b]
Plot1[RightStrength]( High[RightStrength], "PivotHi" ) ;
Alert ;
end
else
NoPlot( 1 ) ;

User avatar
TJ
Posts: 7742
Joined: 29 Aug 2006
Location: Global Citizen
Has thanked: 1033 times
Been thanked: 2222 times

Re: Help with trend lines

Postby TJ » 16 Sep 2014

Look up

TL_GetValue

jayrenard
Posts: 7
Joined: 16 Dec 2013

Re: Help with trend lines

Postby jayrenard » 17 Sep 2014

hello TJ thanks for helping me.

I have tried th TL_getvalue but I guess I ma not understanding correctly because it is still the same here is my code updated.


inputs: Price( High ), LeftStrength( 3 ), RightStrength( 3 ) ;

variable : HighTL(0);


condition1 = PivotHighVSBar( 1, Price, LeftStrength, RightStrength, RightStrength + 1 ) <> -1 ;
if condition1
then
begin
HighTL= TL_New(Date[RightStrength], Time[RightStrength], High[RightStrength], Date[RightStrength], Time[RightStrength], High[RightStrength]);
TL_SetExtRight(HighTL, True);
IF CLOSE CROSSES ABOVE tl_getvalue(HighTL, Date, Time) then TL_SetExtRight(HighTL, false);
Plot1[RightStrength]( High[RightStrength], "PivotHi" ) ;
Alert ;
end
else
NoPlot( 1 ) ;

User avatar
TJ
Posts: 7742
Joined: 29 Aug 2006
Location: Global Citizen
Has thanked: 1033 times
Been thanked: 2222 times

Re: Help with trend lines

Postby TJ » 17 Sep 2014

hello TJ thanks for helping me.

I have tried th TL_getvalue but I guess I ma not understanding correctly because it is still the same here is my code updated.
::
jayrenard:

You are on the right track.

You have to write out your thoughts... as if you are teaching a child to draw.

Here's what is needed:

1. check to see if CLOSE has crossed above the trendline using TL_GETVALUE (done!)

2. if true... then stop drawing the trendline right there !!!

3. in order to stop the trendline... you have to

3a. decide where do you want the trendline to end.
Three data points are needed -- date? time? price?

3b. tell the trendline this is the end, using TL_SETEND.

3c. tell the trendline no longer needs to extend to the right.


Good luck.

bowlesj3
Posts: 2180
Joined: 21 Jul 2007
Has thanked: 227 times
Been thanked: 429 times

Re: Help with trend lines

Postby bowlesj3 » 17 Sep 2014

Here is something to read. After reading this I think you need to check some things below.
viewtopic.php?f=16&t=10397

Is condition1 true at the point of crossover. In other words is the condition that put the trend line out there in the first place true at the point of crossover. If not then you need to be setting a switch to keep extending that trend line after the trend line was first placed then use the crossover to turn that switch off.

Also, I have a suspicion that when you turn off the right extension the trendline will all of a sudden stop its extension right at the end point of the trend line (jump back or become much shorter all of a sudden). If this is correct (and I think it is), and if this is not what you want, then you need to calculate the per bar slop of the trend line and extend it (the end point itself) every time a new bar finishes at barstatus=2. So while doing this you check the closing price at the end of the current bar that just finished and if it crosses past your end point of the trend line you are calculating at the end of each bar then you stop extending that end point. So basically if I am understanding what you want to do correctly you do not use the extend right feature but rather you do it manually. I have done this. It works well. You do not see any change in the angle of the trend line when you do this. You calculate the slop (or the change per bar) immediately after the trend line is placed.

User avatar
JoshM
Posts: 2195
Joined: 20 May 2011
Location: The Netherlands
Has thanked: 1544 times
Been thanked: 1565 times
Contact:

Re: Help with trend lines

Postby JoshM » 19 Sep 2014

This is quite a hard topic; so far I haven't been able to make it work.

With extending trendlines (adding TL_SetExtRight twice in the code below, once to enable and once to turn off) the chart is a mess:

Image

With using TL_SetEnd_s(), the chart looks better but still not correct: trendlines stop much too soon.

Image

At least, it looks like visually the trendlines end too soon. But it's hard to determine the exit value of the trend line at a certain bar: the trend line properties window only shows the start and end values.

I'm not sure where I'm going wrong. The code for changing the location of the trend line looks correct to me:

Code: Select all

if (Close[1] < TL_GetValue_s(trendLineArray[x], Date[1], Time_s[1])) then

TL_SetEnd_s(trendLineArray[x], Date, Time_s, Close);
Full code:

Code: Select all

{
19-9-14
Trend line should extend to the right until a candle closes above it.
}

Inputs:
LeftStrength(3),
RightStrength(3);

Variables:
isPivotHigh(False),
trendLineID(0),
highOfPivot(0),
arrin(0), // Array index
x(0);

// We need an array since multiple pivots can occur before
// the trend line of the first pivot is invalided (close > trend line)
Arrays:
trendlineArray[](0);

once cleardebug;

if (BarStatus(1) = 2) then begin

isPivotHigh = PivotHighVSBar(1, High, LeftStrength, RightStrength,
RightStrength + 1) <> -1;

if (isPivotHigh) then begin

Plot1[RightStrength](High[RightStrength], "PivotHigh");

arrin = arrin + 1;
Array_SetMaxIndex(trendLineArray, arrin);

trendlineArray[arrin] =
TL_New_s(Date[RightStrength], Time_s[RightStrength],
High[RightStrength], Date, Time_s, Close);

TL_SetSize(trendlineArray[arrin], 2);
TL_SetColor(trendlineArray[arrin], RGB(65, 105, 225));

end else NoPlot(1);

// Adjust the still active trendlines
for x = 0 to Array_GetMaxIndex(trendLineArray) begin

if (trendLineArray[x] > 0) then begin

if (Close[1] < TL_GetValue_s(trendLineArray[x], Date[1], Time_s[1])) then

TL_SetEnd_s(trendLineArray[x], Date, Time_s, Close)

else
trendLineArray[x] = -1; // Discard trendline; price already closed below

end;

end; //: Array loop

end; //: BarClose
I hope someone knows how to solve it (or has a valuable suggestion). Now I also want to know how to do this. :)
Attachments
scr.19-09-2014 20.27.49.png
(11.12 KiB) Downloaded 883 times
scr.19-09-2014 20.26.29.png
(12.04 KiB) Downloaded 887 times

bowlesj3
Posts: 2180
Joined: 21 Jul 2007
Has thanked: 227 times
Been thanked: 429 times

Re: Help with trend lines

Postby bowlesj3 » 19 Sep 2014

I forgot to mention that I wrote a function for moving trend lines since using the individual commands for setting the end points can be difficult and confusing and at times just does not work since you have to have the commands positioned properly. This function works well and will position the trend line perfectly probably 9,999 in 10,000 times (obviously assuming you give it the correct settings). Give it a try and see if things look better (more what you are expecting).

viewtopic.php?f=5&t=7748

User avatar
JoshM
Posts: 2195
Joined: 20 May 2011
Location: The Netherlands
Has thanked: 1544 times
Been thanked: 1565 times
Contact:

Re: Help with trend lines

Postby JoshM » 19 Sep 2014

Thanks for that reference. I've studied the `A_MoveTrendLine_s` function and based a new code version on it:

Code: Select all

if (Close[1] < TL_GetValue_s(trendLineArray[x], Date[1], Time_s[1])) then begin

TL_SetEnd_s(trendLineArray[x], Date, Time_s, Close);
TL_SetBegin_s(trendLineArray[x], TL_GetBeginDate(trendLineArray[x]),
TL_GetBeginTime_s(trendLineArray[x]), TL_GetBeginVal(trendLineArray[x]));

end;
This didn't help, probably the begin point of the trend line is fixed. But it did give me a good idea: extending the trendline one bar further than `TL_GetValue_s` says the line has crossed (so that the crossing is made visible). That did seemingly work.

So with this code:

Code: Select all

if (Close[1] < TL_GetValue_s(trendLineArray[x], Date[1], Time_s[1])) then begin

TL_SetEnd_s(trendLineArray[x], Date, Time_s, Close);
barNumExtension = CurrentBar;

end else begin

if ((barNumExtension + 1) = CurrentBar) or ((barNumExtension + 2) = CurrentBar) then

TL_SetEnd_s(trendLineArray[x], Date, Time_s, Low)

else
trendLineArray[x] = -1; // Discard trendline; already closed below

end;
Gives the following chart:

Image

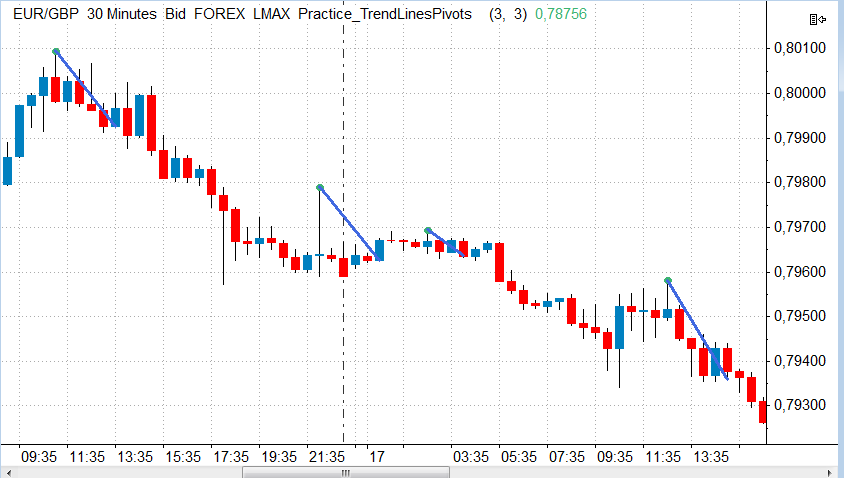
This seems correct to me: the bar on which the trend line ends, is the bar that closes above the trend line.

PS: I do wonder how it works in real-time, because Pivots are already suffering from hindsight, and these trend lines make that even worse. That is because they are extend (redrawn) on every bar, until the price closes above it. In other words, the final trend line that is seen on historical data is not the same as the trend drawn during the actual move itself.

* * * *

Code: Select all

{
19-9-14
Trend line should extend to the right until a candle closes above it.
}

Inputs:
LeftStrength(3),
RightStrength(3);

Variables:
isPivotHigh(False),
trendLineID(0),
highOfPivot(0),
arrin(0), // Array index
barNumExtension(0),
x(0);

// We need an array since multiple pivots can occur before
// the trend line of the first pivot is invalided (close > trend line)
Arrays:
trendlineArray[](0);

once cleardebug;

if (BarStatus(1) = 2) then begin

isPivotHigh = PivotHighVSBar(1, High, LeftStrength, RightStrength,
RightStrength + 1) <> -1;

if (isPivotHigh) then begin

Plot1[RightStrength](High[RightStrength], "PivotHigh");

arrin = arrin + 1;
Array_SetMaxIndex(trendLineArray, arrin);

trendlineArray[arrin] =
TL_New_s(Date[RightStrength], Time_s[RightStrength],
High[RightStrength], Date, Time_s, Close);

TL_SetSize(trendlineArray[arrin], 2);
TL_SetColor(trendlineArray[arrin], RGB(65, 105, 225));

end else NoPlot(1);

// Adjust the still active trendlines
for x = 0 to Array_GetMaxIndex(trendLineArray) begin

if (trendLineArray[x] > 0) then begin

if (Close[1] < TL_GetValue_s(trendLineArray[x], Date[1], Time_s[1])) then begin

TL_SetEnd_s(trendLineArray[x], Date, Time_s, Close);
barNumExtension = CurrentBar;

end else begin

if ((barNumExtension + 1) = CurrentBar) or ((barNumExtension + 2) = CurrentBar) then

TL_SetEnd_s(trendLineArray[x], Date, Time_s, Low)

else
trendLineArray[x] = -1; // Discard trendline; already closed below

end;

end;

end; //: Array loop

end; //: BarClose
Attachments
scr.19-09-2014 22.29.12.png
(10.54 KiB) Downloaded 870 times

jayrenard
Posts: 7
Joined: 16 Dec 2013

Re: Help with trend lines

Postby jayrenard » 20 Sep 2014

thx Tj , BowlesJ3 and JoshM for sharing all this knowledge. JoshM I did copy your code and looks good here too. waiting for monday to see how it performs. Do you or anybody knows how to make this trendline horizontal? (I tried in your code without success)

bowlesj3
Posts: 2180
Joined: 21 Jul 2007
Has thanked: 227 times
Been thanked: 429 times

Re: Help with trend lines

Postby bowlesj3 » 20 Sep 2014

thx Tj , BowlesJ3 and JoshM for sharing all this knowledge. JoshM I did copy your code and looks good here too. waiting for monday to see how it performs. Do you or anybody knows how to make this trendline horizontal? (I tried in your code without success)
If I was to read your question without putting it into the context of the above code I would simply say you set the price value equal on both the start and end points to make a trend line horizontal. Having said that, it has been years since I moved trendlines without my function but I seem to remember the trick was the TL_setbegin had to be applied to the oldest end point (most historic) and the TL_setend then had to be set. So you kind of had to know the location of the end points first (that was what my function figured out). There was also a vertical component that had to be taken into account and my function did that too. If you get this wrong the trendline would not draw the way you would expect many times (pretty much random - sometimes worked and sometimes didn't). I complained about this but I don't know if they fixed it (not sure if I created a PM for it). I do know I wrote a script to test that function and I gave it every possible combination of prior trend line anchor points and I could not get it to fail (fixed the problem). I also ran it for several years 8 hours a day with probably a good 100,000 to 1 million moves and I estimate it screwed up a move maybe 20 to 30 times (probably due to a fractional inaccuracy in my calculation due to not enough decimal points). I also put a trap in the code to detect a miss move and report it and come to think of it I would say it reported less than 10 times. So what I am saying is if using my function does not fix the problem then the logic of the code itself has a problem (I have no time to study the logic).

I can say one thing about the last graph. It looks pretty consistent. I assume it is consistently wrong and that should make it solvable. The line drawing issue would not do what was in that last graph. The lines would be all over the place.

User avatar
JoshM
Posts: 2195
Joined: 20 May 2011
Location: The Netherlands
Has thanked: 1544 times
Been thanked: 1565 times
Contact:

Re: Help with trend lines

Postby JoshM » 24 Sep 2014

I can say one thing about the last graph. It looks pretty consistent. I assume it is consistently wrong and that should make it solvable.
What makes my example seem consistently wrong? I'm not asking to defend it (it very well might be wrong) but to learn from it.

bowlesj3
Posts: 2180
Joined: 21 Jul 2007
Has thanked: 227 times
Been thanked: 429 times

Re: Help with trend lines

Postby bowlesj3 » 24 Sep 2014

Hi Josh,

Nothing makes it appear consistently wrong except that you said you were trying to solve it and it was a tough one so my assumption was that you were saying it was wrong. I have not even looked at the code myself. If you said it it is looking good I would have said "yeah it looks consistent so that suggests that it is doing what you want". I have no idea what is going on - LOL. Just saying that the line movement must be working since it is consistent.

John


Return to “MultiCharts”