With standard bars we can easily select the left tick and right tick to get a line per bar but volume delta bars have their own width which it's not compatible with the left and right tick
how to code lines per bar on volume delta charts? [SOLVED]
-
arnie

- Posts: 1594
- Joined: 11 Feb 2009
- Location: Portugal
- Has thanked: 481 times
- Been thanked: 514 times
how to code lines per bar on volume delta charts?
Is there a way to code lines (not trendlines since we cannot move them to back) like the ones on the volume delta chart?
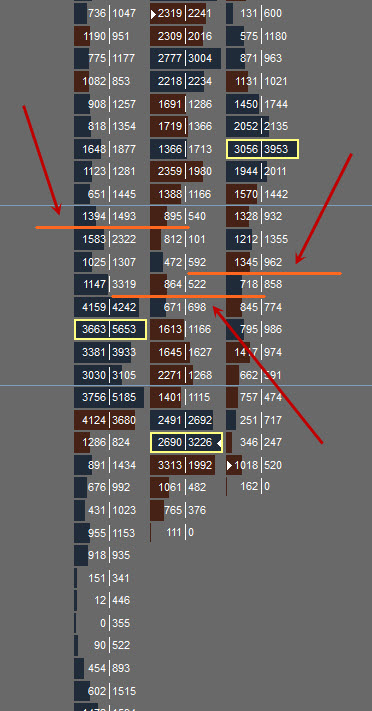
With standard bars we can easily select the left tick and right tick to get a line per bar but volume delta bars have their own width which it's not compatible with the left and right tick
With standard bars we can easily select the left tick and right tick to get a line per bar but volume delta bars have their own width which it's not compatible with the left and right tick
- Attachments
-
- tpo_lines.jpg
- (54.52 KiB) Downloaded 430 times
-
- foot_lines.jpg
- (101.14 KiB) Downloaded 431 times
-
TJ

- Posts: 7742
- Joined: 29 Aug 2006
- Location: Global Citizen
- Has thanked: 1033 times
- Been thanked: 2222 times
Re: how to code lines per bar on volume delta charts?
Use a loop to PLOT a series of dash.Is there a way to code lines (not trendlines since we cannot move them to back) like the ones on the volume delta chart?
::
-
arnie
- Posts: 1594
- Joined: 11 Feb 2009
- Location: Portugal
- Has thanked: 481 times
- Been thanked: 514 times
Re: how to code lines per bar on volume delta charts? [SOLVED]
But the problem continues the same. The left and right dash it's not compatible with the volume delta bar width.Use a loop to PLOT a series of dash.
Each left and right dash it's being plotted at the normal standard bar space, not the volume delta bar's.
Code: Select all
	plot7(barMidpoint , "leftBarMid");

		plot8(barMidpoint , "rightBarMid");


	for ii = 1 to ShiftLinesLeft begin

		plot9[ii](barMidpoint , "leftBarMid");

		plot10[ii](barMidpoint , "rightBarMid");

	end;


	for ii = 1 to ShiftLinesRight begin

		plot11[-ii](barMidpoint , "leftBarMid");

		plot12[-ii](barMidpoint , "rightBarMid");

	end;
So...
... with this simple code
Code: Select all
      plot7(barMidpoint , "leftBarMid");

		SetPlotWidth(7,100);

		plot8(barMidpoint , "rightBarMid");

		SetPlotWidth(8,100);
Just set the left and right dash as bar high and bar low.
- Attachments
-
- tpo_lines03.jpg
- (72.12 KiB) Downloaded 410 times
-
- tpo_lines02.jpg
- (26.37 KiB) Downloaded 412 times