Download: summidx.ELA
File Includes: Indicator - McClellan
Category: Indicator > Oscillators
Description:
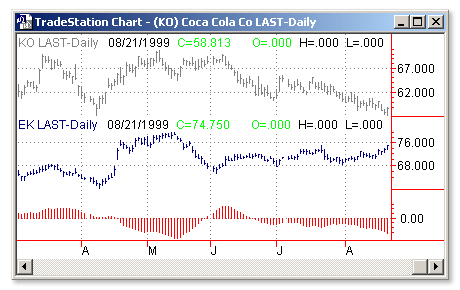
The McClellan Oscillator is a market breadth indicator that is based on the smoothed difference between the number of advancing and declining issues on the New York Stock Exchange.
The McClellan Oscillator was developed by Sherman and Marian McClellan. Extensive coverage of the oscillator is provided in their book Patterns for Profit.
Usage:
The McClellan Oscillator offers many types of structures for interpretation, but there are two main ones. First, when the Oscillator is positive, it generally portrays money coming into the market; conversely, when it is negative, it reflects money leaving the market. Second, when the Oscillator reaches extreme readings, it can reflect an overbought or oversold condition.
Indicators that use advancing and declining issues to determine the amount of participation in the movement of the stock market are called "breadth" indicators. A healthy bull market is accompanied by a large number of stocks making moderate upward advances in price. A weakening bull market is characterized by a small number of stocks making large advances in price, giving the false appearance that all is well. This type of divergence often signals an end to the bull market. A similar interpretation applies to market bottoms, where the market index continues to decline while fewer stocks are declining.
The McClellan Oscillator is one of the most popular breadth indicators (another popular breadth indicator is the Advance/Decline Line). Buy signals are typically generated when the McClellan Oscillator falls into the oversold area of -70 to -100 and then turns up. Sell signals are generated when the oscillator rises into the overbought area of +70 to +100 and then turns down.
If the oscillator goes beyond these areas (i.e., rises above +100 or falls below -100), it is a sign of an extremely overbought or oversold condition. These extreme readings are usually a sign of a continuation of the current trend.
For example, if the oscillator falls to -90 and turns up, a buy signal is generated. However, if the oscillator falls below -100, the market will probably trend lower during the next two or three weeks. You should postpone buying until the oscillator makes a series of rising bottoms or the market regains strength.

EasyLanguage Code:
INPUTS: ADVISSUES(CLOSE OF DATA1), DECISSUES(CLOSE OF DATA2), FASTLENGTH(19), SLOWLENGTH(39);


PLOT1(MCCLELLANOSC(ADVISSUES, DECISSUES, FASTLENGTH, SLOWLENGTH), "MCCLELLAN");


{ALERT CRITERIA}

IF PLOT1 CROSSES ABOVE 0 THEN

	ALERT("MCCLELLAN OSCILLATOR HAS CROSSED ABOVE ZERO")

ELSE

	IF PLOT1 CROSSES BELOW 0 THEN

		ALERT("MCCLELLAN OSCILLATOR HAS CROSSED BELOW ZERO");


{EXPERT COMMENTARY}

#BEGINCMTRY

	COMMENTARY(EXPERTMCCLELLAN(PLOT1));

#END;


{*******************************************************************

MCCLELLANOSC FUNCTION CODE:

********************************************************************}


INPUTS: ADVISSUES(NUMERICSERIES), DECISSUES(NUMERICSERIES), FASTLENGTH(NUMERIC), SLOWLENGTH(NUMERIC);


VARIABLES: PRICEDIFF(0);


PRICEDIFF = ADVISSUES - DECISSUES;


MCCLELLANOSC = XAVERAGE(PRICEDIFF, FASTLENGTH) OF DATA1 - XAVERAGE(PRICEDIFF, SLOWLENGTH) OF DATA1;