Download: project.ela
File Includes:
Indicator - Upper/Lower Pro Band
Indicator - Proj Bandwith
Indicator - Projection Oscillato
Category: Indicator > Bands
Description:
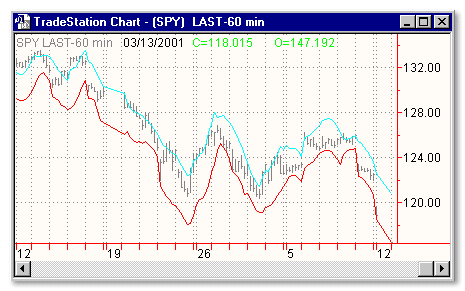
Projection bands, a new method using trading bands, projects market data forward along the data trend with the maxima and minima of the projections defining the band. The method provides another means of signaling potential changes for market direction relative to the trend.
The projection bands will be the maximum and minimum projected price about today's close, C[i]. The upper and lower projection bands provide reference points that enable you to measure whether the market is at the extreme high, low or somewhere in between relative to the extremes for the last 14 days.
This indicator is calculated according to the next formula:
Upper Projection Band = PUC i = MAX (C i,j ), for j = i-n+1 to i
where: C[i,j] = C[j] + SC[i,n](i - j )
SC[i,n] represents the slope of least-squares line fit to closing data.
i - refers to today's trading day
j - refers to each lookback trading day
n - refers to the lookback period of n trading days
Usage:
Bands define the upper and lower boundaries of a security's normal trading range. A sell signal is generated when the security reaches the upper band whereas a buy signal is generated at the lower band. The optimum percentage shift depends on the volatility of the security--the more volatile, the larger the percentage.
The logic behind bands is that overzealous buyers and sellers push the price to the extremes (i.e., the upper and lower bands), at which point the prices often stabilize by moving to more realistic levels.

Inputs:
Length - number of trailing bars to average
EasyLanguage Code:
INPUTS: LENGTH(14);

VARS:    SL(0), SH(0), PL(0), PU(0);


SL=LINEARREGSLOPE(LOW,LENGTH);

SH=LINEARREGSLOPE(HIGH,LENGTH);


FOR VALUE1=1 TO LENGTH BEGIN

	VALUE2=LOW[VALUE1-1] + (SL*VALUE1-1);

	VALUE3=HIGH[VALUE1-1] + (SH*VALUE1-1);

	IF  VALUE1=1 THEN BEGIN

	    PL=VALUE2;

	    PU=VALUE3;

     END;

     IF VALUE2THEN PL=VALUE2;

     IF VALUE3>PU THEN PU=VALUE3;

END;


PLOT1(PL,"PL");

PLOT2(PU,"PU");


{COPYRIGHT C 1997, TECHNICAL ANALYSIS, INC.}