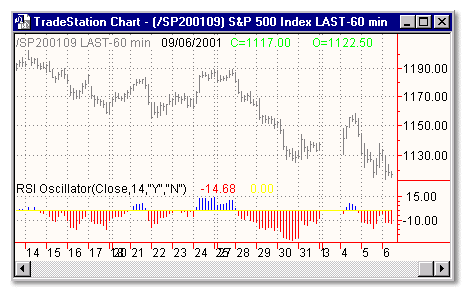
Download: rsiosc.ela
File Includes:
Indicator - Pivot Point Levels
PaintBar - RSI Above 50
Paintbar - RSI Below 50
Category: Oscillator > RSI Oscillator
Description:
This is an indicator presented in the article mentioned above.
The Autor tried to use it as a trend identificator.
Usage:
If RSI is greater than 50 - the trend is uptrend
If RSI is lower than 50 - the trend is downtrend

Inputs:
Price - price data to use
RSILen - number of bars to calculate RSI
HistGram - plots as a histogram
Line - plots as a line
EasyLanguage Code:
INPUTS: PRICE(CLOSE), RSILEN(14), HISTGRAM("Y"), LINE("N");

VARS: RSIVAL(0);


RSIVAL = RSI(PRICE, RSILEN);


IF UPPERSTR(HISTGRAM) = "Y" OR UPPERSTR(HISTGRAM) = "YES" THEN BEGIN

	IF RSIVAL >= 50 THEN

		PLOT1(RSIVAL - 50, "+RSI_OSC")

	ELSE

		PLOT2(RSIVAL - 50, "-RSI_OSC");

END;


IF UPPERSTR(LINE) = "Y" OR UPPERSTR(LINE) = "YES" THEN

	PLOT3(RSIVAL - 50, "RSI_OSC");


PLOT4(0, "EVEN-LINE");


IF RSIVAL CROSSES BELOW 50 OR RSIVAL CROSSES ABOVE 50 THEN

	ALERT = TRUE;


{

COPYRIGHT C 1997, TECHNICAL ANALYSIS, INC.

}