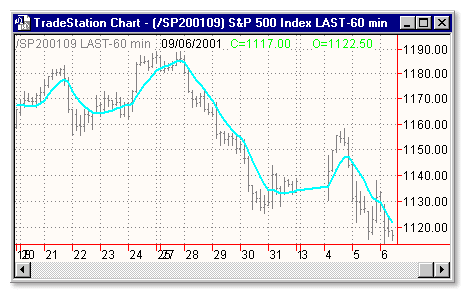
Download: smooth.ela
File Includes:
Indicator - IE/2
Function - GD
Indicator - T3
Category: Averages > IE/2
Description:
IE/2 is one of pre-studies created while T3 famous average was developing. It is calculated as (ILRS(n)+EPMA(n))/2.
ILRS, is an integral of linear regression slope. In this moving average, the slope of a linear regression line is simply integrated as it is fitted in a moving window of length n across the data. The derivative of ILRS is the linear regression slope.
EPMA is an end point moving average - it is the endpoint of the linear regression line of length n as it is fitted across the data. EPMA hugs the data more closely than a simple or exponential moving average of the same length.
Usage:
The most popular method of interpreting a moving average is to compare the relationship between a moving average of the security's price with the security's price itself (or between several moving averages).

Inputs:
Price - price data to use
Period - number of bars to use in calculation
EasyLanguage Code:
INPUTS: PRICE(CLOSE), PERIOD(15);

VARS: ILRS(0), EPMA(0), IE(0);


ILRS = LINEARREGSLOPE(PRICE, PERIOD) + AVERAGE(PRICE, PERIOD);

EPMA = LINEARREGVALUE(PRICE, PERIOD, 0);

IE =  (ILRS + EPMA) / 2;


PLOT1(IE, "IE/2");


IF CLOSE CROSSES ABOVE PLOT1 OR CLOSE CROSSES BELOW PLOT1 THEN

	ALERT = TRUE;


{COPYRIGHT C 1997, TECHNICAL ANALYSIS, INC.}