Download: Stoch.ela
File Includes:
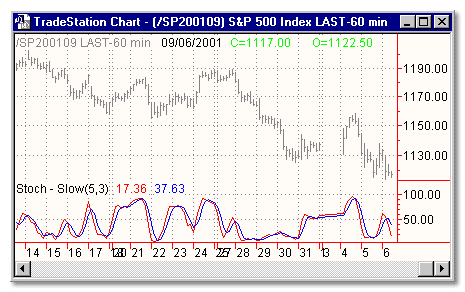
Indicator - Stoch - Slow
Function - StochDreg
Function - StochDslow
Function - StochKreg
Function - StochKslow
Indicator - Stoch - Reg
Category: Indicator > Oscillators
Description:
The Stochastic Oscillator compares where a security's price closed relative to its price range over a given time period. This is slow version of the oscillator. It is calculated according to this formula:
Usage:
There are several ways to interpret a Stochastic Oscillator.
Three popular methods include:
- Buy when the Oscillator (either %K or %D) falls below a specific level (e.g., 20) and then rises above that level. Sell when the Oscillator rises above a specific level (e.g., 80) and then falls below that level.
- Buy when the %K line rises above the %D line and sell when the %K line falls below the %D line.
- Look for divergences. For example, where prices are making a series of new highs and the Stochastic Oscillator is failing to surpass its previous highs.
Inputs:
Length - number of bars to use in calculation
SlowLen - number of bars to use in calculation
EasyLanguage Code:
INPUTS: LENGTH(5), SLOWLEN(3);


PLOT1(STOCHKSLOW(LENGTH, SLOWLEN), "%K-SLOW");

PLOT2(STOCHDSLOW(LENGTH, SLOWLEN), "%D-SLOW");