Download: t3.ela
File Includes:
Indicator - T3
Function - T3Average
Function - T3Average.series
Function - T3Average.simple
Function - XAverage.V
Indicator - T3Average
Indicator - T3.Demo
Category: Averages > T3
Description:
This indicator plots the moving average described in the January, 1998 issue of S&C, p.57, "Smoothing Techniques for More Accurate Signals", by Tim Tillson. This indicator plots indicators presented in Figure 1 in the article - they are 2 benchmark averages ILRS and EPMA, and a difference between them.
The first benchmark moving average (MA) is called ILRS, which stands for integral of linear regression slope. In this moving average, the slope of a linear regression line is simply integrated as it is fitted in a moving window of length n across the data. The derivative of ILRS is the linear regression slope. ILRS is not the same as a simple moving average (SMA) of length n, which is actually the midpoint of the linear regression line as it moves across the data. One can measure the lag of moving averages with respect to a linear trend by computing how they behave when the input is a line with unit slope. Both SMA(n) and ILRS(n) have lag of n/2, but ILRS is much smoother than SMA.
The second benchmark is the end point moving average (EPMA). It is the endpoint of the linear regression line of length n as it is fitted across the data. EPMA hugs the data more closely than a simple or exponential moving average of the same length.
Please refer article to get more information.
Usage:
The most popular method of interpreting a moving average is to compare the relationship between a moving average of the security's price with the security's price itself (or between several moving averages).
Inputs:
Price - price series to use
Periods - number of bars to calculate
Filter - filter
Start - start time
EasyLanguage Code:
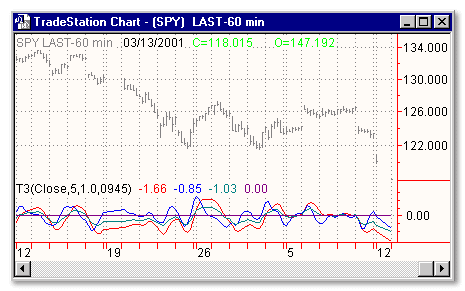
INPUTS:  PRICE(CLOSE), PERIODS(5), FILTER(1.0), START(0945);


VARS: LASTTIME(9999), T3(0), TREND(0), BUYTGT(0), SELLTGT(0), SLOPE(0), SLOPE2(0), LRLEN(2);


IF (TIME < LASTTIME)

THEN BEGIN

    BUYTGT = 99999;

    SELLTGT = 0;

END;

LASTTIME = TIME;


T3 = T3AVERAGE(PRICE, PERIODS);


{ *******

IF (T3 > T3[1]) THEN TREND = 1 ELSE TREND = -1;

IF (TIME > START)

THEN BEGIN

IF (TREND <> TREND[1])

THEN BEGIN

    IF (TREND > 0)

    THEN BEGIN

        EXITSHORT;

        BUYTGT = HIGH + FILTER;

        SELLTGT = 0;

    END

    ELSE BEGIN

        EXITLONG;

        SELLTGT = LOW - FILTER;

        BUYTGT = 99999;

    END;

END;


IF (BUYTGT < 99999) THEN BUY BUYTGT STOP;

IF (SELLTGT > 0) THEN SELL SELLTGT STOP;


END;


*******}


{*******

SLOPE = LINEARREGSLOPE(T3, LRLEN);

SLOPE2 = LINEARREGSLOPE(SLOPE, LRLEN);

IF (SLOPE2 > SLOPE2[1]) THEN TREND = 1 ELSE TREND = -1;

********}


SLOPE = T3 - T3[2];

SLOPE2 = SLOPE - SLOPE[2];

PLOT1(SLOPE, "SLOPE");

PLOT2(SLOPE2, "SLOPE2");

PLOT3(T3-T3[1], "SLOPE1PER");

PLOT4(0, "");