Download: t3.ela
File Includes:
Indicator - T3.Demo
Function - T3Average
Function - T3Average.series
Function - T3Average.simple
Function - XAverage.V
Indicator - T3
Indicator - T3Average
Category: Averages > T3Average.Demo
Description:
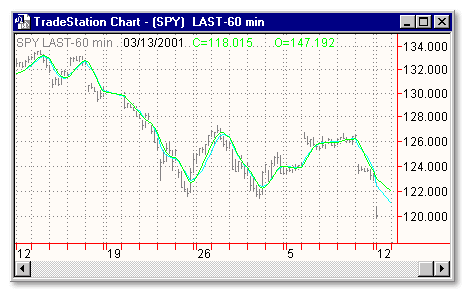
This indicator plots the moving average described in the January, 1998 issue of S&C magazine, p.57, "Smoothing Techniques for More Accurate Signals", by Tim Tillson.
It uses the previous T3Average function, the new T3Average.series function, and the new T3Average.simple function.
The new T3Average.simple function duplicates the response of the previous T3Average function. The demo shows the effect of dynamically varying the "Periods" input with the T3Average.simple function as a function of volatility.
Usage:
The most popular method of interpreting a moving average is to compare the relationship between a moving average of the security's price with the security's price itself (or between several moving averages).

Inputs:
Price - data series to use
Periods - number of bars to calculate
EasyLanguage Code:
INPUTS: PRICE(CLOSE), PERIODS(5);


VARS:   YYY(5);


IF TRUERANGE <> 0 THEN

   YYY = PERIODS * (1 + VOLATILITY(10) / TRUERANGE) / 2;


PLOT1(T3AVERAGE(PRICE, PERIODS),"T3.PREV");

PLOT2(T3AVERAGE.SIMPLE(PRICE, YYY),"T3.SIMPLE");

PLOT3(T3AVERAGE.SERIES(PRICE, PERIODS),"T3.SERIES");