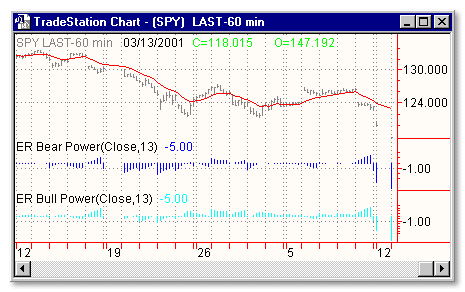
Download: elderray.ela
File Includes:
Indicator - ER Bear Power
Indicator - ER Elder Ray Avg
Indicator - ER Bull Power
Category: Indicator > Averages
Description:
Developed by Dr Alexander Elder, the Elder-ray indicator measures buying and selling pressure in the market. The Elder-ray is often used as part of the Triple Screen trading system but may also be used on its own.
Dr Elder uses a 13-day exponential moving average (EMA) to indicate the market consensus of value. Bull Power measures the ability of buyers to drive prices above the consensus of value. Bear Power reflects the ability of sellers to drive prices below the average consensus of value.
Bull Power is calculated by subtracting the 13-day EMA from the day's High. Bear power subtracts the 13-day EMA from the day's Low.
Usage:
Only trade in the direction of the trend - indicated by the slope of the 13-day EMA.
- Go long if Bear Power is below zero and there is a bullish divergence.
- Go short if Bull Power is above zero and there is a bearish divergence.
Further trading rules can be found in "Trading For A Living" by Dr Alexander Elder.
If you wish to pyramid your position:
- Increase your long position whenever Bear Power dips below zero and then rises back into positive.
- Increase your short position whenever Bull Power rises above zero and then falls back into negative.

Inputs:
Price - the data series to average
AvgLen - the trailing number of bars to average
Easy Language Code:
INPUTS: PRICE(CLOSE), AVGLEN(13);

VARS:  DAYLOW(0), BEARP(0);


IF DATE > DATE[1] THEN

	DAYLOW = LOW;

BEARP = DAYLOW - XAVERAGE(PRICE, AVGLEN);


PLOT1(BEARP, "BEAR PWR");