Download: MOV3.ELA
Category: Indicator > Averages
Description:
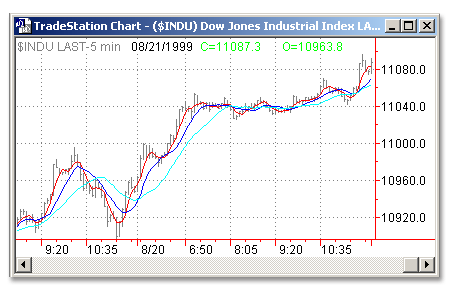
The moving average may be the most widely used indicator. The Mov Avg 3 line indicator calculates and plots three simple arithmetic averages of the same prices, specified by the Price input, from each of the most recent number of bars specified by the Length inputs. For example, the default setting is to calculate and plot a simple average of the closing prices of the last 4 bars, the last 9 bars and the last 18 bars. The shorter (also known as faster) the length of an average the more sensitive it will be to current price changes than longer (slower) averages.
Usage:
Moving averages are generally used for trend identification. Attention is given to the direction in which the averages are moving and to the relative position of prices and the averages. Rising moving average values (direction) and prices above the short moving average and the shorter moving averages above the longer moving averages (position) would indicate an uptrend. Declining moving average values and prices below the short moving average and the shorter moving averages below the longer moving averages would indicate a downtrend. Using multiple moving averages may make it easier to gauge neutral periods, or differentiate between strong and weak trends. Displaced moving averages plot the moving average values of a previous bar or later bar on the current bar.

Inputs:
Price - Value to be used in calculating the Moving Averages
Length1 - Number of bars of data to be included in calculation of SimpAvg1
Length2 - Number of bars of data to be included in calculation of SimpAvg2
Length3 - Number of bars of data to be included in calculation of SimpAvg3
Displace - Number of bars to displace the plot of the Moving Averages
EasyLanguage Code:
INPUT: PRICE(CLOSE), LENGTH1(4), LENGTH2(9), LENGTH3(18), DISPLACE(0);

VARIABLES: ABSDISP(0);


IF DISPLACE >= 0 OR CURRENTBAR > ABSVALUE(DISPLACE) THEN BEGIN

	PLOT1[DISPLACE](AVERAGEFC(PRICE, LENGTH1), "SIMPAVG1");

	PLOT2[DISPLACE](AVERAGEFC(PRICE, LENGTH2), "SIMPAVG2");

	PLOT3[DISPLACE](AVERAGEFC(PRICE, LENGTH3), "SIMPAVG3");


	{ALERT CRITERIA}

	CONDITION1 = PLOT1 <> 0;

	IF PLOT1 >= PLOT2 AND PLOT1 >= PLOT1[1] AND PRICE >= PLOT1 AND CONDITION1 THEN

		ALERT("MOVING AVERAGE 3 LINES HAS ISSUED A BULLISH SIGNAL")

	ELSE

		IF PLOT1 < PLOT2 AND PLOT1 < PLOT1[1] AND PRICE < PLOT1 AND CONDITION1 THEN

			ALERT("MOVING AVERAGE 3 LINES HAS ISSUED A BEARISH SIGNAL");


END;