Download: 123DOUBLEBOTTOMS.ela
File Includes: Indicator - 123DOUBLEBOTTOMS
Category: Indicator > Swing Identificator
Description:
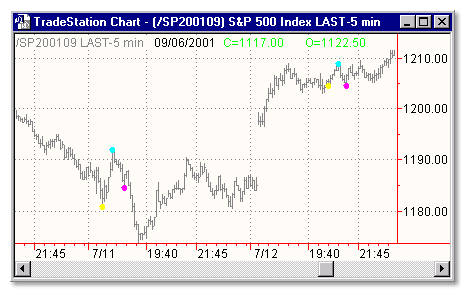
This technical analysis indicator is a combination of several ideologies at work. Perhaps best know as the Ken Robert's 1-2-3 top or bottom, this chart pattern is no more than a simplified Elliot wave move.
Usage:
I do not recommend trading on this pattern alone, but in conjunction with the other trading techniques covered in this section, it is worth having a basic understanding of what a 1-2-3 formation represents.
Inputs:
LPrice - low price
HPrice - high price
Strength - specifies required number of bars on either side of the swing bar
Length - number of bars to use in calculation
Limiter - limit
Offset3 - offset
EasyLanguage Code:
INPUT:LPRICE(L),HPRICE(H),STRENGTH(1),LENGTH(50),LIMITER(10),OFFSET3(.5);


VALUE1 = SWINGLOW(2,LPRICE,STRENGTH,LENGTH);

VALUE2 = SWINGLOW(1,LPRICE,STRENGTH,LENGTH);

VALUE3 = SWINGHIGH(1,HPRICE,STRENGTH,LENGTH);

VALUE11 = SWINGLOWBAR(2,LPRICE,STRENGTH,LENGTH);

VALUE12 = SWINGLOWBAR(1,LPRICE,STRENGTH,LENGTH);

VALUE13 = SWINGHIGHBAR(1,HPRICE,STRENGTH,LENGTH);


IF VALUE1 <

    VALUE2 AND

    VALUE2 <

    VALUE3 AND

    VALUE13 >

    VALUE12 + LIMITER AND

    VALUE11 >

    VALUE13 + LIMITER THEN BEGIN

        PLOT1[VALUE11](VALUE1,"1");

        PLOT2[VALUE13](VALUE3,"2");

        PLOT3[VALUE12](VALUE2 - OFFSET3,"3");

END;