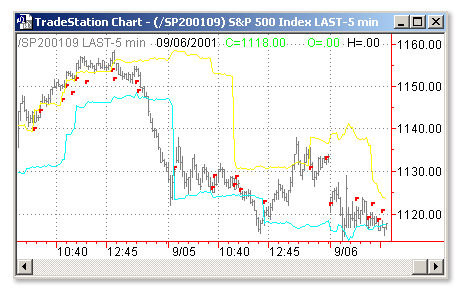
Download: MACD BOUT.ELA
File Includes:
Indicator - ELD MACD BOUT
Category: Indicator > Trend Identificator
Description:
This indicator draws a channel around the price data using the differential calculation of the MACD and an exponential average of the MACD. When the MACD differential crosses under and/or over the zero line frequently, we consider the market to be moving sideways, or being directionless. This indicator will find the last few instances of the MACD differential crossing zero, and will define an upper and lower channel by looking back for the highest and lowest price points.
The bands are calculated by finding the last 4 instances of cross over and cross under bars, and finding the highest high and lowest low, and then adding an extra measure. This extra measure is calculated as an expression of the true range.
The objective of this trading technique is to find an instance where the market starts moving strongly in a certain direction after a period of directionless (sideways) movement.
Usage:
This indicator will trigger an alert when the price bars move outside of the trading bands.
For ideas on implementing a trading strategy with this indicator, download the macdbreak.eld file and use the MACD Breakout Strategy.

Inputs:
FastMA - Number of bars used to calculate the fast exponential average of the MACD
SlowMA - Number of bars used to calculate the slow exponential average of the MACD
MacdMA - Number of bars used to smooth the MACD calculation
NCOs - Number of cross over/under instances to use In the calculation of the bands
Nbars - Number of bars to look back for MACD cross over/under instances
EasyLanguage Code:
input: FastMA(9),SlowmA(26),MacdMA(4), NCOs(4), NBars(50);

vars: MVal(0), MAvg(0), MDif(0), Counter(0), TotalBars(0),

		HighestHi(0), LowestLo(0);

array: CO[2,50](0);


MVal = MACD( Close, FastMA,SlowmA );

MAvg = XAverage( MACD( Close, FastMA, SlowmA ),MacdMA );

MDif = MVal - MAvg;


{ Store the MACD Cross information in the CO array }

if  MDif Crosses Over 0 or MDIF Crosses Under 0 then begin

	Alert("MACD Band Breakout");

	for counter = 0 to 49 begin

		CO[ 0, 50-Counter ] = CO[ 0, 49-Counter ];

		CO[ 1, 50-Counter ] = CO[ 1, 49-Counter ];

		CO[ 2, 50-Counter ] = CO[ 2, 49-Counter ];

		end;

	CO[0,0] = Barnumber;

	CO[1,0] = High;

	CO[2,0] = Low;

end;


{ Find the Highest High and the Lowest Low of the cross over and under bars }

HighestHi = -1;

LowestLo = 9999;

for counter = 0 to NCOs-1 begin

	if CO[ 1, counter ] > HighestHi then

		HighestHi = CO[ 1 , counter ];

	If CO[ 2, counter ] < LowestLo then

		LowestLo = CO[ 2 , counter ];

	end;


if MDif crosses over 0 then

	Plot1( High, "Cross" );

if MDif crosses under 0 then

	Plot1( Low, "Cross" );


Totalbars = Barnumber - CO[ 0, NCOs-1 ];

if TotalBars < NBars then begin

	Plot3( HighestHi + Average(Truerange, 4 ) * .9, "TopBand" );

	Plot4( LowestLo - Average(Truerange, 4 ) * .9, "BotBand" );

end;