Download: MACDRS.ela
File Includes:
Indicator - MACDRS
Function - RS
Category: Indicator > Trend Identificator
Description:
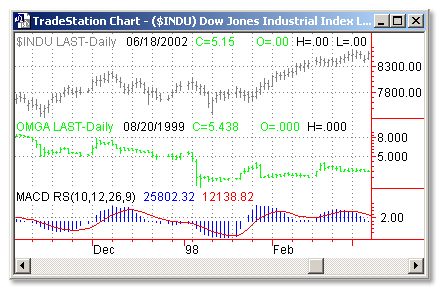
This indicator is created for identifying positive and negative trading signals for stocks and mutual funds. The indicator constructed from RS indicator and its moving average convergence/divergence (MACD).
The indicator uses 2 data streams, when the RS ratio is falling, the data#1 is underperforming the data#2 and vice versa. After that the classic moving average convergence/divergence (MACD) indicator have been applied.
Usage:
Go long only if:
- The MACD of the weekly data#1/data#2 ratio is greater than zero, and
- The MACD is above its trigger line.
Go short only if:
- The MACD of the weekly data#1/data#2 ratio is lower than zero, and
- The MACD is below its trigger line.

Inputs:
RSLen - number of bars to calculate RSI
FastMA - number of bars to calculate Fast MA
SlowMA - number of bars to calculate Slow MA
MacdMA - number of bars to calculate MACD
EasyLanguage Code:
INPUT: RSLEN(10),FASTMA(12),SLOWMA(26),MACDMA(9);

PLOT1(MACD(RS(RSLEN), FASTMA, SLOWMA),"DIFF");

PLOT2(XAVERAGE(MACD(RS(RSLEN), FASTMA, SLOWMA), MACDMA),"SIGNAL");

IF CHECKALERT THEN BEGIN

  IF PLOT1 CROSSES ABOVE PLOT2 OR PLOT1 CROSSES BELOW PLOT2

  THEN ALERT;

END;