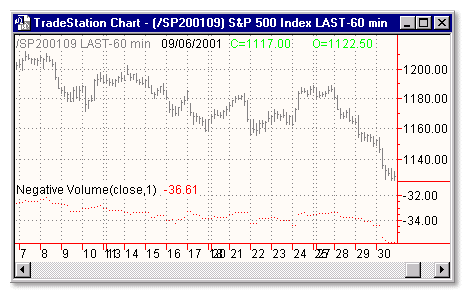
Download: negvol.ela
File Includes:
Indicator - Negative Volume
Function - NVI
Category: Indicator > Volume Based
Description:
Negative volume index (NVI) is based on the theory that trading by unsophisticated investors occurs predominantly on days of high volume while sophisticated investors trade during quieter periods of declining volume. Thus, a negative change in volume reflects buying and selling of stocks by those "in the know".
NVI is calculated by adding the stock's percentage gain or loss to the previous value whenever the volume drops from the preceding period. Usually, stock prices drop whenever the volume drops. However, when the stock price rises on lower volume days, it is considered very positive.
Usage:
The interpretation of the NVI assumes that on days when volume increases, the crowd-following "uninformed" investors are in the market. Conversely, on days with decreased volume, the "smart money" is quietly taking positions. Thus, the NVI displays what the smart money is doing.
In Stock Market Logic, Norman Fosback points out that the odds of a bull market are 95 out of 100 when the NVI rises above its one-year moving average. The odds of a bull market are roughly 50/50 when the NVI is below its one-year average. Therefore, the NVI is most usefuly as a bull market indicator.

Inputs:
Price - the data series to average
Length - the parameter tells how many bars to average
EasyLanguage Code:
INPUTS: PRICE(CLOSE), LENGTH(1) ;


PLOT1( NVI(PRICE, LENGTH), "NVI");