Download: volaccumpcnt.ela
File Includes: Indicator - Volume Accum Percent
Category: Indicator > Volume Based
Description: This is another variation of the Volume Accumulation Percentage Indicator. The Volume Accumulation is constructed the same way as the OBV except that it weights the volume by a measure of the intraday volatility.
The Volume Adjusted (VA) is:
VA = Volume(Daily) * {(Close-Low)-(High-Close)}/(High-Low).
And the Volume Accumulation is the volume accumulation of the previous day plus the volume adjusted of the day.
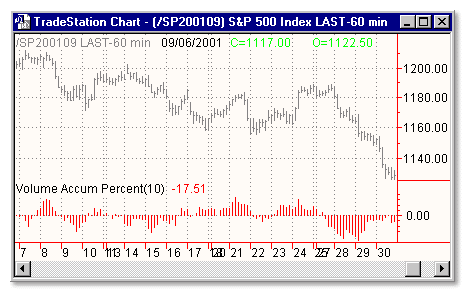
Usage:
The Volume Accumulation (VACC) is analyzed the same way as the OBV. The Volume Accumulation must be analyzed in line with the general trend of the underlying stock and must confirm a general trend.
In a positive trend, if the stock price is closed to his new high, the Volume Accumulation should be at his maximum as well (and of course at his minimum in a negative trend). If the market is looking for a direction, the Volume Accumulation is analyzed another way. If the price is in the bottom side of his current trading range and if, at the same moment the Volume Accumulation increases, the Volume Accumulation shows us that there is accumulation on the stock and that the prices should start to climb. The sale signal is given when the Volume Accumulation decreases (distribution).
Inputs:
Length - number of bars to consider
EasyLanguage Code:
INPUTS: LENGTH(10);

VARS: OBVT(0), OBVPER(0), XT(0), VT(0) , TV(0), TVA(0),   VA(0)  ;


IF (TRUEHIGH - TRUELOW) <> 0 THEN BEGIN


XT =  (  (CLOSE - TRUELOW)  -  (TRUEHIGH - CLOSE) )  /  (TRUEHIGH - TRUELOW)      ;


TV = SUMMATION(VOLUME, LENGTH);


TVA = SUMMATION( VOLUME * XT, LENGTH );


IF TV <> 0 THEN BEGIN

   VA = (TVA / TV) * 100;

   PLOT1( VA, "VOLACCUM%");

END;


END;