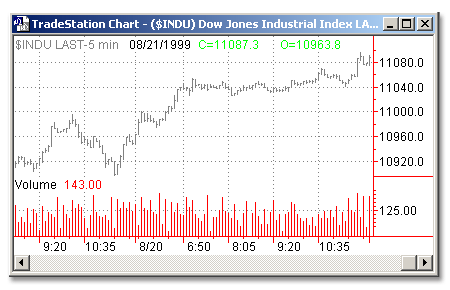
Download: VOLUME.ELA
Category: Indicator > Volume Based
Description:
Volume for current session, or the daily volume if data compression is set to daily.
Usage:
Volume is simply the number of shares (or contracts) traded during a specified time frame (e.g., hour, day, week, month, etc). The analysis of volume is a basic yet very important element of technical analysis. Volume provides clues as to the intensity of a given price move.
Low volume levels are characteristic of the indecisive expectations that typically occur during consolidation periods (i.e., periods where prices move sideways in a trading range). Low volume also often occurs during the indecisive period during market bottoms.
High volume levels are characteristic of market tops when there is a strong consensus that prices will move higher. High volume levels are also very common at the beginning of new trends (i.e., when prices break out of a trading range). Just before market bottoms, volume will often increase due to panic-driven selling.
Volume can help determine the health of an existing trend. A healthy up-trend should have higher volume on the upward legs of the trend, and lower volume on the downward (corrective) legs. A healthy downtrend usually has higher volume on the downward legs of the trend and lower volume on the upward (corrective) legs.

Inputs:
EasyLanguage Code:
IF DATACOMPRESSION >= 2 THEN

	PLOT1(VOLUME, "VOLUME")

ELSE

	PLOT1(UPTICKS + DOWNTICKS, "VOLUME");