Basic Definitions
Indicator
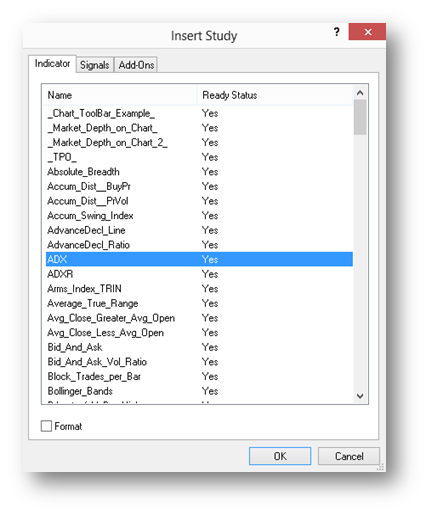
Indicators in MultiCharts .NET allow the user to analyze price and trade information and to graphically display it on the chart. To add an Indicator on a chart, right-click on the chart, click Insert Study, select the Indicator tab, then select the required Indicator and click OK.
For example, the ADX indicator calculation results will appear in a graph displayed at the bottom of the chart.
In MultiCharts .NET indicators are objects of the class, inherited from IndicatorObject class. Indicators, unlike other types of studies (functions, signals), can create and use plot objects (IPlotObject). These objects allow indicators to draw graphs, histograms, bars, etc. Before using plots, they should be created in the Create () method of indicator class using the AddPlot() method.
Here is an example of a simple indicator, which draws a gaps graph of day bars (the difference between the current bar open and the previous bar close in percent) in the form of histogram at the bottom of the chart:
public class DAY_GAP : IndicatorObject {
	public DAY_GAP(object _ctx):base(_ctx){}
	private IPlotObject plot_gap;//Plot object for graph drawing
	protected override void Create() {
		//Adds a graph to the chart
		plot_gap = AddPlot(new PlotAttributes("GAP", EPlotShapes.Histogram, Color.Red));
	}
	protected override void CalcBar(){
		// Determines next bar plot value
		plot_gap.Set(100*((Bars.Open[0] - Bars.Close[1])/Bars.Open[0]));
	}
}