Bollinger Bands
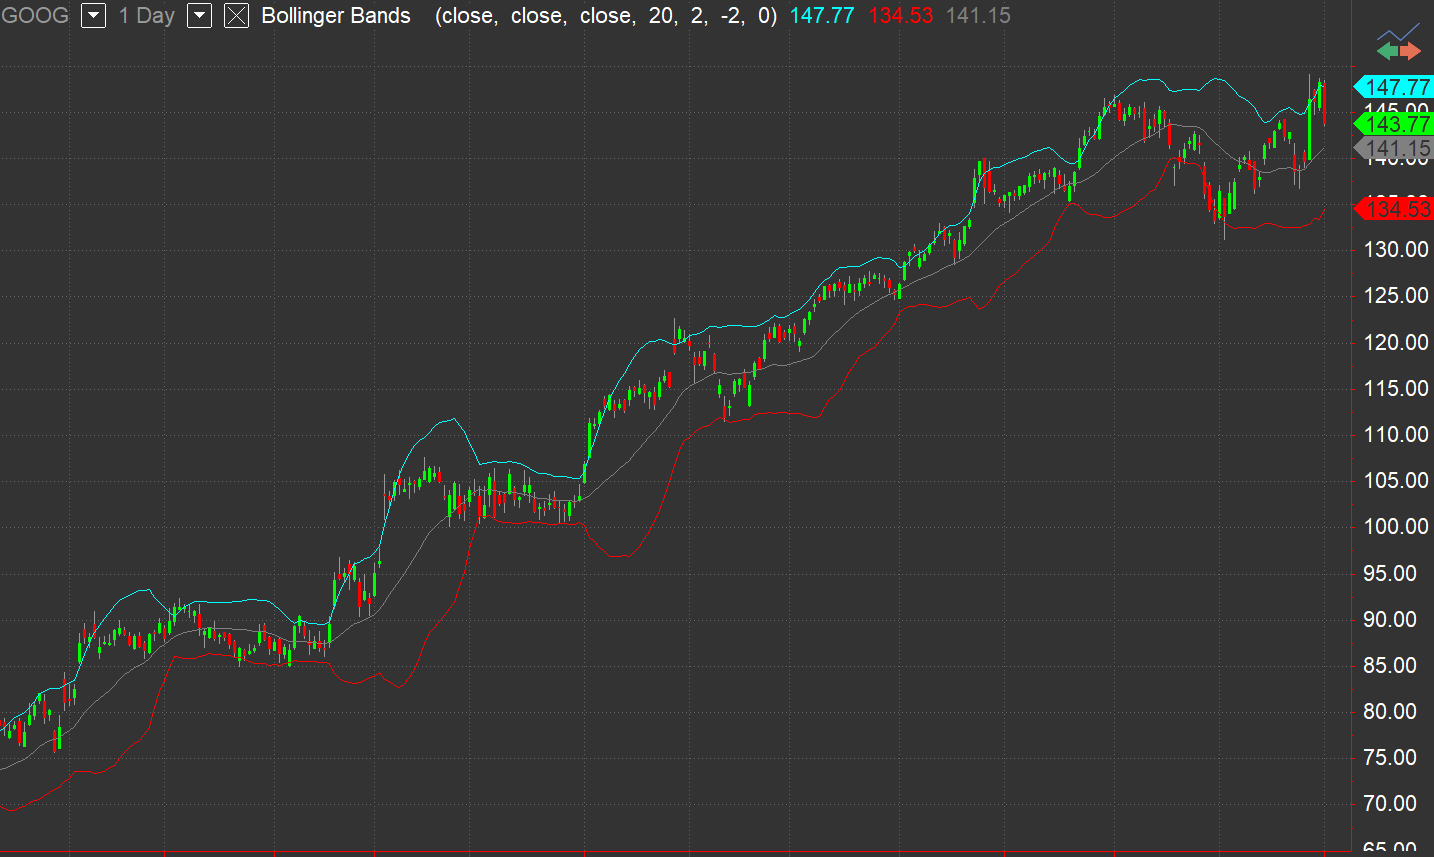
Bollinger Bands consist of a band of three lines which are plotted in relation to security prices. The line in the middle is usually a Simple Moving Average (SMA) set to a period of 20 days (The type of trend line and period can be changed by the trader; however a 20 day moving average is by far the most popular). The SMA then serves as a base for the Upper and Lower Bands. The Upper and Lower Bands are used as a way to measure volatility by observing the relationship between the Bands and price. Typically the Upper and Lower Bands are set to two standard deviations away from the SMA (The Middle Line); however the number of standard deviations can also be adjusted by the trader.
Default Inputs
BollingerPrice (Close) sets the price on which the calculation of the bands is based.
TestPriceUBand (Close) triggers an alert when this price crosses under UpperBand.
TestPriceLBand (Close) triggers an alert when this price crosses over LowerBand.
Length (20) sets the number of bars of data to be considered.
NumDevsUp (2) sets the number of standard deviations used to calculate the upper Bollinger Band.
NumDevsDn (-2) sets the Number of standard deviations used to calculate the lower Bollinger Band.
Displace (0) sets the plot offset by the specified number of bars.