Chaos Awesome Oscillator
Definition
Chaos Awesome Oscillator is an indicator used to measure market momentum. AO calculates the difference between a 34 Period and 5 Period Simple Moving Average. The Simple Moving Averages that are used are not calculated using closing price but rather each bar's midpoints. AO is generally used to affirm trends or to anticipate possible reversals.
Chaos Awesome Oscillator was created by Bill Williams.
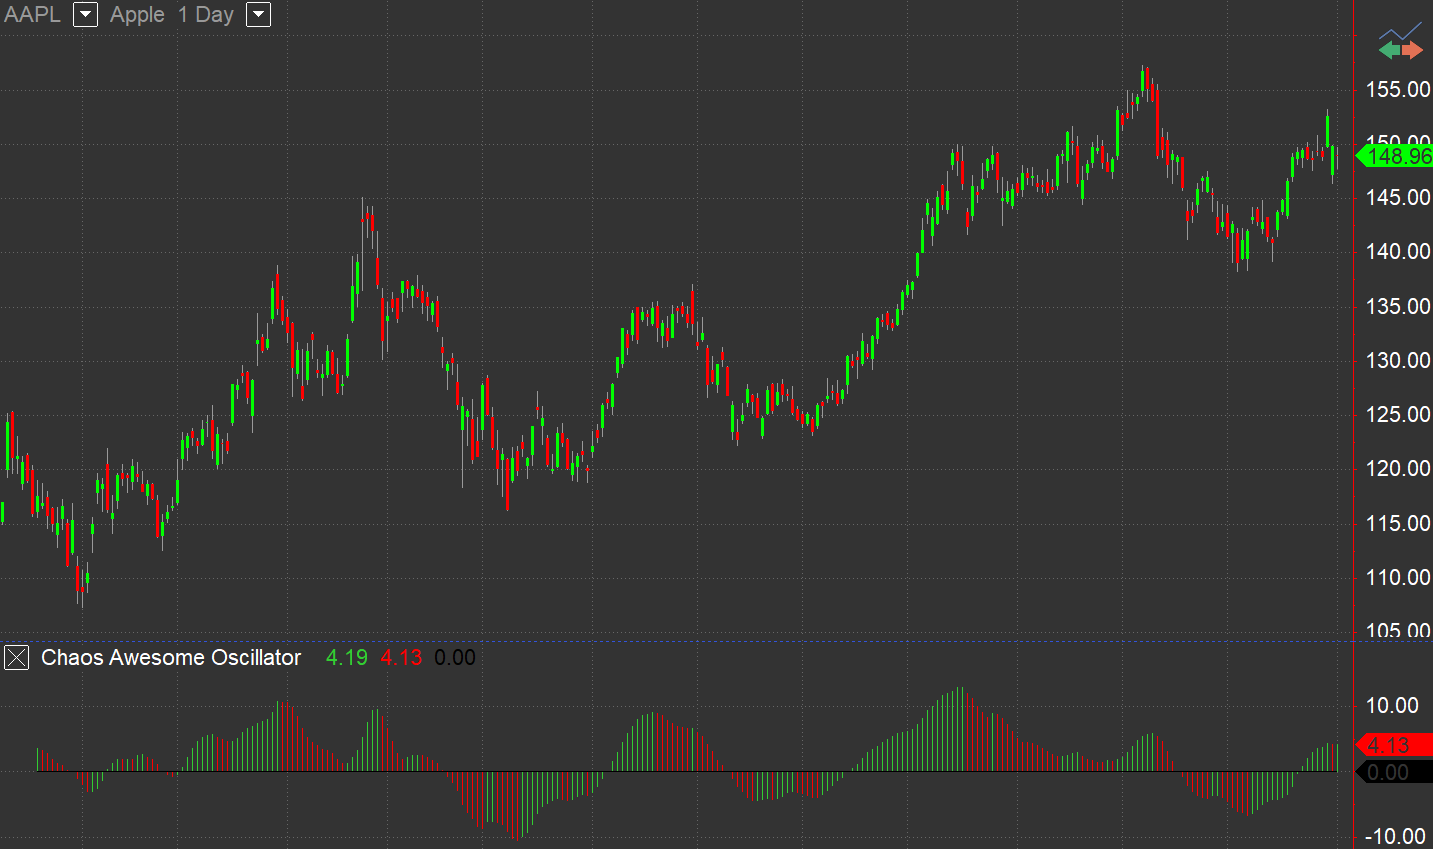
Because of its nature as an oscillator, Chaos Awesome Oscillator is designed to have values that fluctuate above and below a Zero Line. The generated values are plotted as a histogram of red and green bars. A bar is green when its value is higher than the previous bar. A red bar indicates that a bar is lower than the previous bar. When AO's values are above the Zero Line, this indicates that the short term period is trending higher than the long term period. When AO's values are below the Zero Line, the short term period is trending lower than the Longer term period. This information can be used for a variety of signals.
Default Plots
+AO shows that AO crosses above the Zero Line.
-AO shows that AO crosses below the Zero Line.
ZeroLine shows zero line.