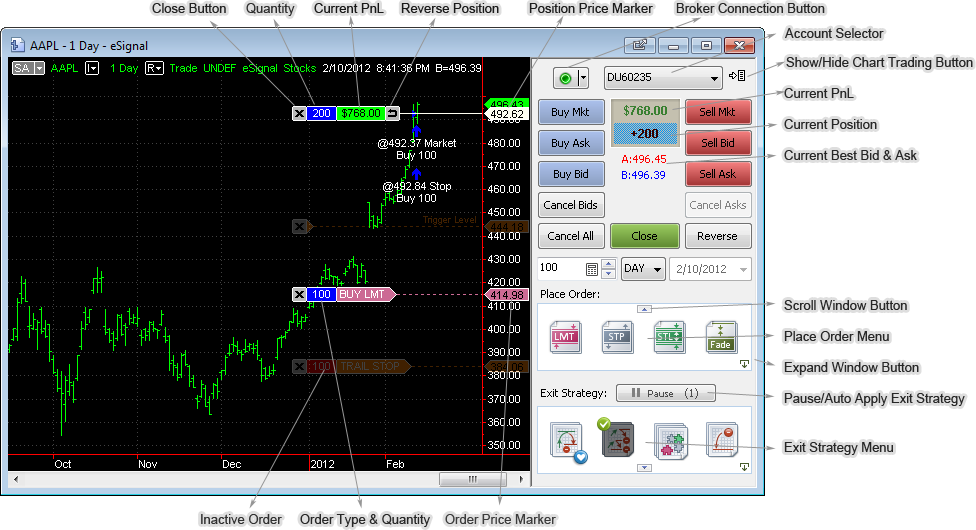
Chart Trading
The chart trading panel allows placing manual orders directly from a chart. The chart is cursor-sensitive, so right-clicking on the chart will create an order at the price level you clicked on. Orders can be also dragged and dropped directly to a specific price on the chart.
You can send single orders and entire strategies using the methods described above. MultiCharts supports simple single orders, One-Cancels-Other order groups (OCO), as well as automated entry and exit strategies. The Entry Automation and Exit Automation strategies can be applied by drag-and-drop or by right-clicking to individual orders, and entire positions (See Place Order and Exit Strategies).
Orders can be changed or cancelled by right-clicking them and choosing the appropriate option in the shortcut menu or from the Chart trading panel itself. Strategy levels (such as profit target and stop loss) can also be easily changed and moved around. Strategy names are shown on the appropriate levels, showing where the orders came from.
Active orders are shown in a bright color, while dependent inactive orders (wait for the active order to be filled before becoming active) are shown in transparent colors. Changing the size, or the price, of the parent order will automatically recalculate and update the dependent orders.
Contents
Show/Hide Chart Trading Panel
To show/hide chart trading panel, click the Chart Trading Panel button  at the top-right corner of the chart.
Selecting Broker
To select a broker, click the arrow on the Broker Connection button  and select a broker in drop-down menu.
For more info see Broker Profiles
Connecting / Disconnecting Broker Profile
When a broker is selected, click the Broker Connection button to connect or disconnect it.
For more info see Broker Profiles
Selecting Account
Select the account number in the Account Selector box  .
.