GradientColor
Jump to navigation
Jump to search
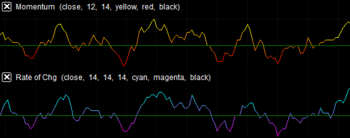
Returns a RGB color number, representing a shade of color from within a defined color range.
The gradient shade of color is determined by the value of the specified numerical expression in relation to the defined value range.
For example, if the color range is defined as White to Black, and the value range is defined from 0 to 2, GradientColor will return an RGB color number representing White for the value of 0, Gray for the value of 1, and Black for the value of 2. White will be returned for all values < 0, and Black for all values > 2.
Usage
GradientColor(Value, Min, Max, StartColor, EndColor)
Where:
- Value – the specified numerical expression.
- Min – the minimum value of the value range. If Value is equal to or lower than the minimum value, the StartColor is returned.
- Max – the maximum value of the value range. If Value is equal to or greater than the maximum value, the EndColor is returned.
- StartColor – the starting color of the gradient color range.
- EndColor – the ending color of the gradient color range.
Example
Plot an ADX indicator in Gradient Color, where Magenta gradually changes into White for the indicator values from 5 to 50:
Variable: ADXValue(0);

ADXValue = ADX(14);
Plot1(ADXValue, "ADXValue");

SetPlotColor(1, GradientColor (ADXValue, 5, 50, Magenta, White));
