HL Bar Chart
Jump to navigation
Jump to search
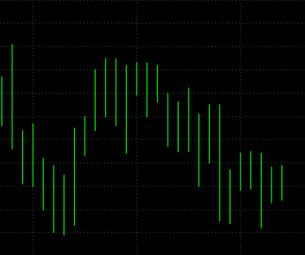
HL Bar Chart visually presents the data series as a sequence of bars.
Each HL bar is a vertical line connecting the High and the Low price points (ticks), and graphically represents the range of an instrument’s price movement over a defined interval.
An HL Bar has one component: High/Low.
The color and width of each of the bar's component can be customized in the Chart Style section.
Note: HL Bar Type is available only for Regular, Renko and Cumulative Delta chart types.
Selecting HL Chart Type
Chart type can be selected from the Format Instruments window:
- Open the Format Instruments window.
To open the Format Instruments window, click the Format Instruments icon on the main toolbar;
if the Format Objects window appears, select the symbol and click the Format button.
The Format Instruments window can also be opened by one of the following methods:
- Position the mouse pointer over the symbol's data series; double-click once the Pointer changes into a Hand
  ;
;
- Position the mouse pointer over the symbol's data series; once the Pointer changes into a Hand
  right-click and then click Format Symbol Name;
- Right-click on an empty area of the chart and then click Format Instruments; if the Format Objects window appears, select the symbol and click the Format button;
- Select Format in the main menu and click Instrument; if the Format Objects window appears, select the symbol and click the Format button. - Select the Style tab.
- In the Chart Type list box select HL Bar.
Setting HL Chart Style
Chart style can be set from the Format Instruments window:
- Open the Format Instruments window.
To open the Format Instruments window, click the Format Instruments icon on the main toolbar;
if the Format Objects window appears, select the symbol and click the Format button.
The Format Instruments window can also be opened by one of the following methods:
- Position the mouse pointer over the symbol's data series; double-click once the Pointer changes into a Hand
  ;
;
- Position the mouse pointer over the symbol's data series; once the Pointer changes into a Hand
  right-click and then click Format Symbol Name;
- Right-click on an empty area of the chart and then click Format Instruments; if the Format Objects window appears, select the symbol and click the Format button;
- Select Format in the main menu and click Instrument; if the Format Objects window appears, select the symbol and click the Format button. - Select the Style tab.
- In the Chart Style section click on the component element to be changed.
- From the drop-down list select a style.
- To display the Last Price Marker check the Last Price Marker check box, or uncheck the box to hide the marker; the color of the marker is the same as of the Close component.
- To use these style settings for all new charts of this type, check Use as Default check box.
Changing Bar Weight
To change bars' Weight:
- click Increase Weight
 or
or - click Decrease Weight
 icon on the Control toolbar,
 - select Format in the main menu and click Increase Weight or Decrease Weight.
