McClellan Osc
Definition
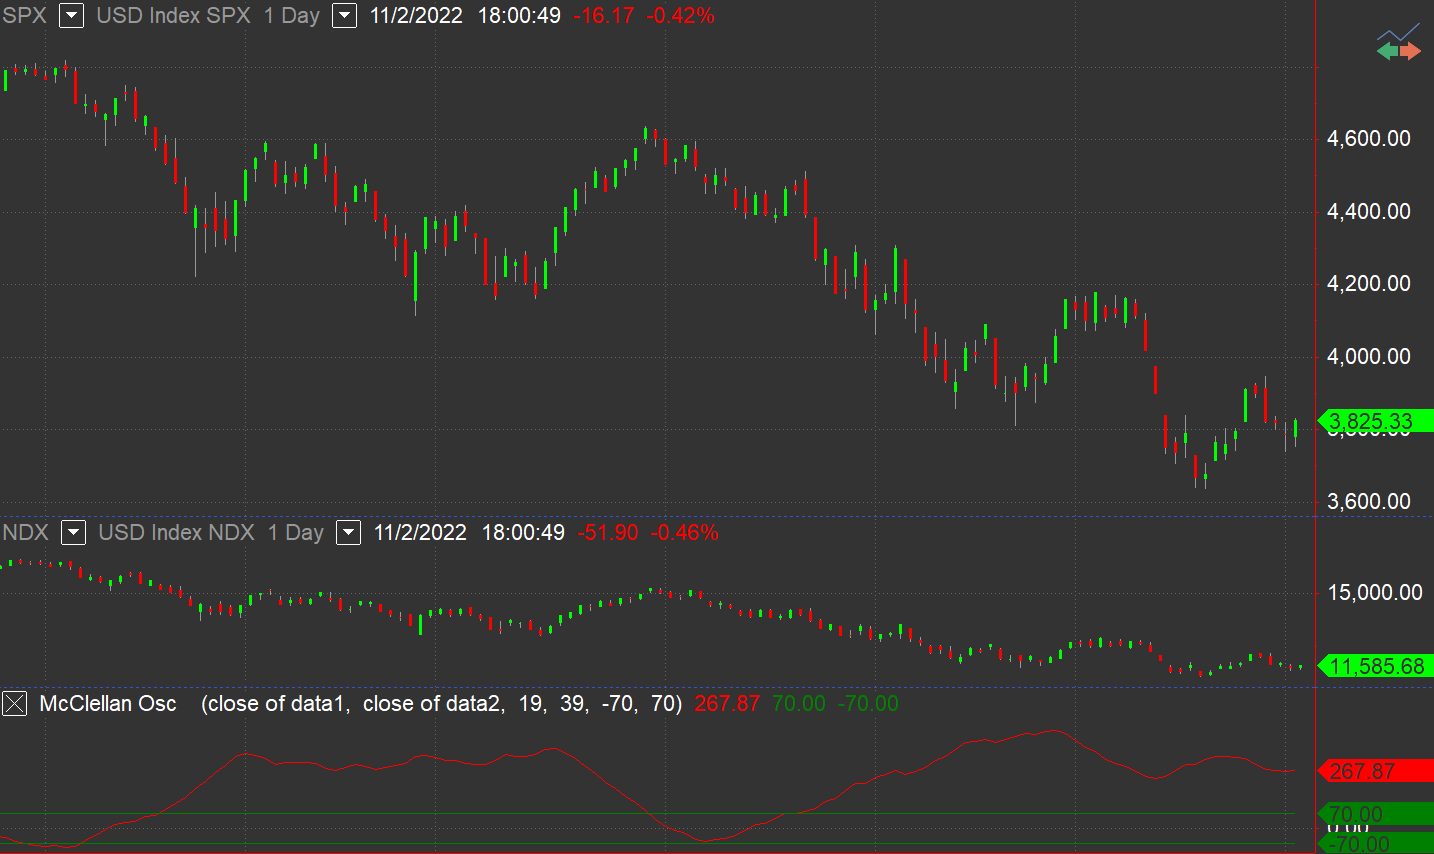
The McClellan Oscillator calculates the difference between Advancing Issues and Declining Issues, then calculates two exponential averages of this difference. The difference between the 2 averages is calculated and plotted on the chart. The difference between advancing issues and declining issues is known as market breadth. For example, if a stock market index is rallying but there are more issues declining than advancing, then the rally is narrow and much of the stock market is not participating.
The McClellan Oscillator uses averages and differences based on this data to gauge market breadth. The chart must contain both the Advancing Issues and the Declining Issues and the inputs must specify the correct DataN number for each for the McClellan Oscillator to be plotted accurately. As the McClellan Oscillator uses exponential averages, the numeric value of the McClellan Oscillator will depend on the data available in the chart.
Default Inputs
AdvIssues - price data representing Advancing Issues
DecIssues - price data representing Declining Issues
FastLength - number of bars to be included into fast exponential average
SlowLength - number of bars to be included into slow exponential average
OverSold - value representing the oversold level
OverBought - value representing the overbought level
Plots
- McClOsc - plots the McClellan Oscillator value.
- OverBot - plots the overbought reference line
- OverSld - plots the oversold reference line
The plots will be desplayed in a separate subschart.