Momentum
Definition
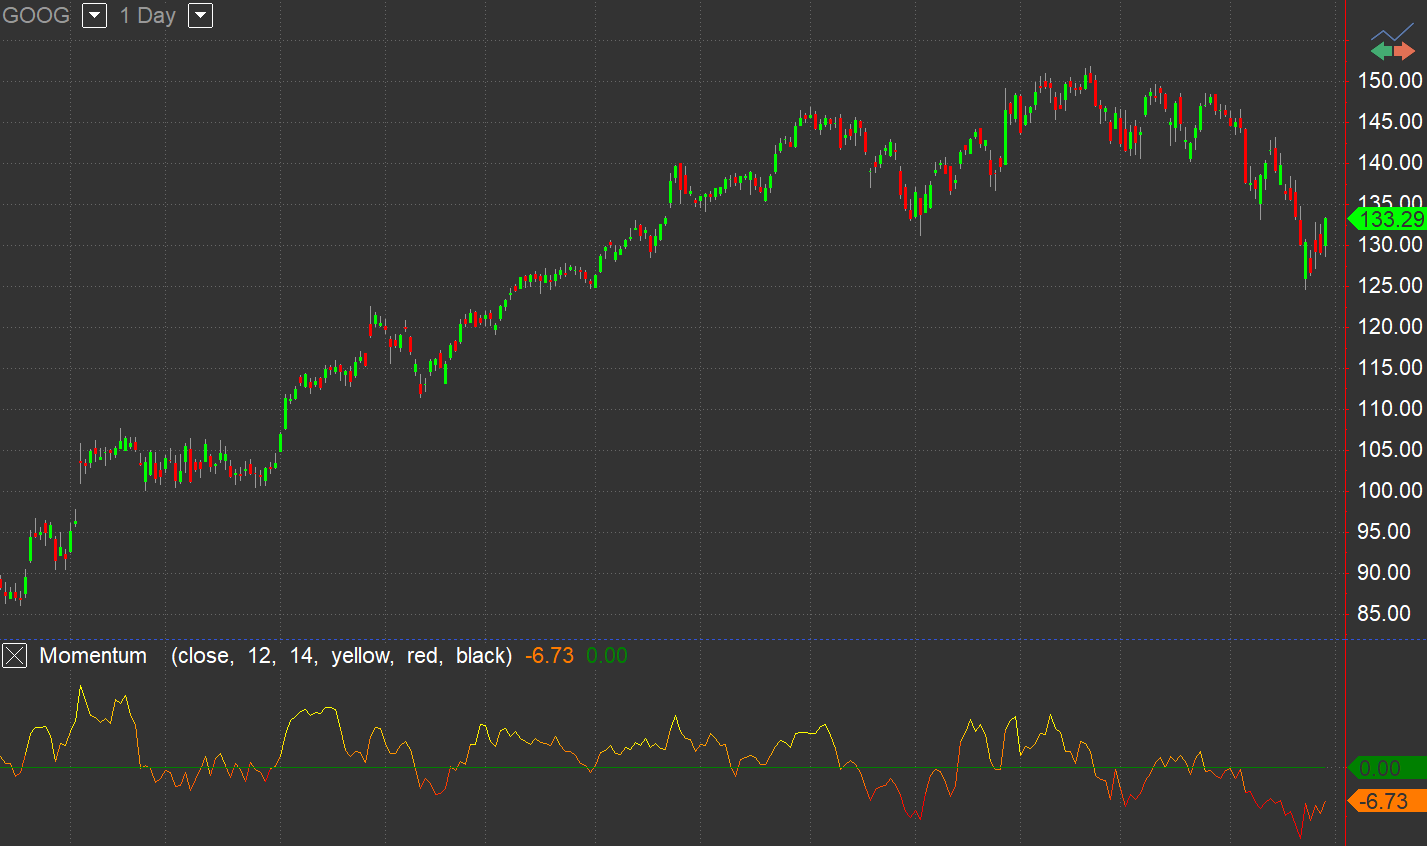
The Momentum indicator calculates and plots the net change, expressed in points, between each bar's price, as specified by the Price input, and that price the number of bars ago specified in the Length input. When the default settings are used, the indicator calculates and plots the net change between the close of a bar and the close ten bars earlier. It allows to see a trend in its development and possible trend reversals. It may also help to identify overbought and oversold conditions when the Momentum is extremely strong or weak.
Default Inputs
Price - price used for Momentum calculation
Length - number of bars for Momentum calculation
ColorNormLength - number of bars used to normalize the indicator for gradient coloring
UpColor - color used for values that are relatively high over ColorNormLength bars. Set to -1 to disable gradient color plotting
DnColor - color used for values that are relatively lowover ColorNormLength bars. Set to -1 to disable gradient color plotting
GridForegroundColor - color used for numbers in Scanner when gradient coloring is enabled
Plots
Momentum - plots the Momentum line
ZeroLine - plots a reference line at zero
The plots will be desplayed in a separate subschart.
To disable gradient color plotting, set UpColor and/or DnColor to -1.
When disabled, Momentum is determined by the indicator properties.
ZeroLine plot color always comes from indicator properties dialog box.