Mov Avg 3 Lines
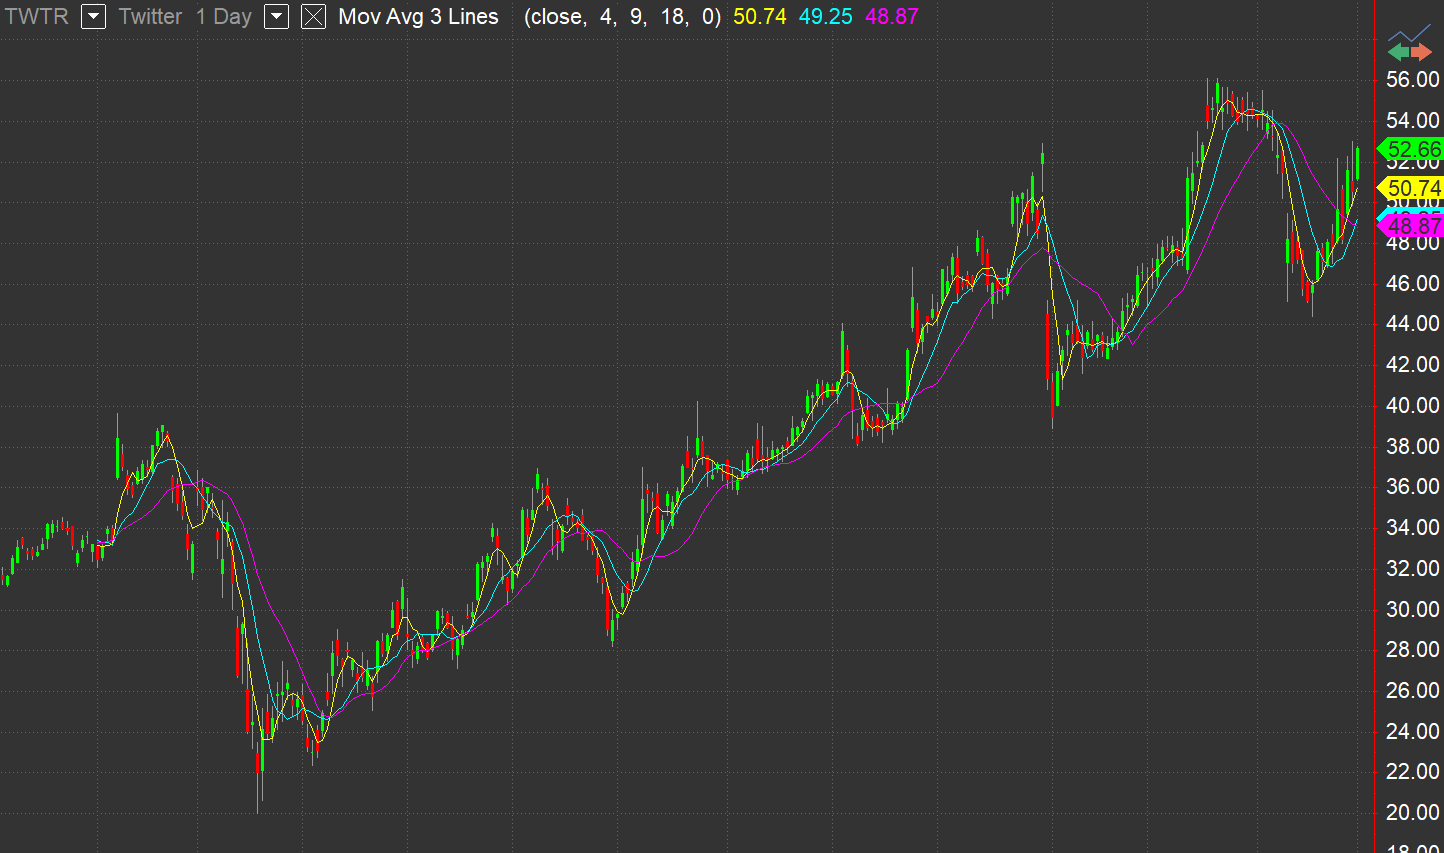
The Mov Avg 3 lines indicator calculates and plots three simple arithmetic averages of the same prices, specified by the fast, medium, and slow price inputs, from the number of most recent bars specified by the fast, medium, and slow length inputs. The indicator with default settings plots a simple averages of the closing prices of the last 4 bars, the last 9 bars and the last 18 bars. The average of shorter length (fast average) will be more sensitive to current price changes than the average of greater length (slow average).
A moving average may be used to identify the trend. The market trend may be defined by the direction in which the averages are moving and the relative position of prices and the averages. Rising moving average values (direction) and prices above the short moving average and the shorter moving averages above the longer moving averages (position) would indicate an uptrend. Declining moving average values and prices below the short moving average and the shorter moving averages below the longer moving averages would indicate a downtrend. Identifying neutral periods or strong and weak trends is easier with multiple moving averages.
Displaced moving averages plot the moving average values of a previous bar or later bar on the current bar. This indicator is not displaced by default. Changing the Displace input to a positive number displaces the plots to the left. Changing the Displace input to a negative number displaces the plots to the right
Default Inputs
FastPrice (Close) - price value used in calculation of the "fast" moving average.
MedPrice (Close) - price value used in calculation of the "medium" moving average.
SlowPrice (Close) - price value used in calculation of the "slow" moving average.
FastLength (4) - number of bars included in calculation of the "fast" average.
MedLength (9) - number of bars included in calculation of the "medium" average.
SlowLength (18) - number of bars included in calculation of the "slow" average.
Displace (0) - number of bars to displace the plot of the moving average.
Plots
Plot1 (FastAvg, Yellow) - fast moving average value.
Plot2 (MedAvg, Cyan) - medium moving average value.
Plot3 (SlowAvg, Magenta) - slow moving average value.