Mov Avg Crossover
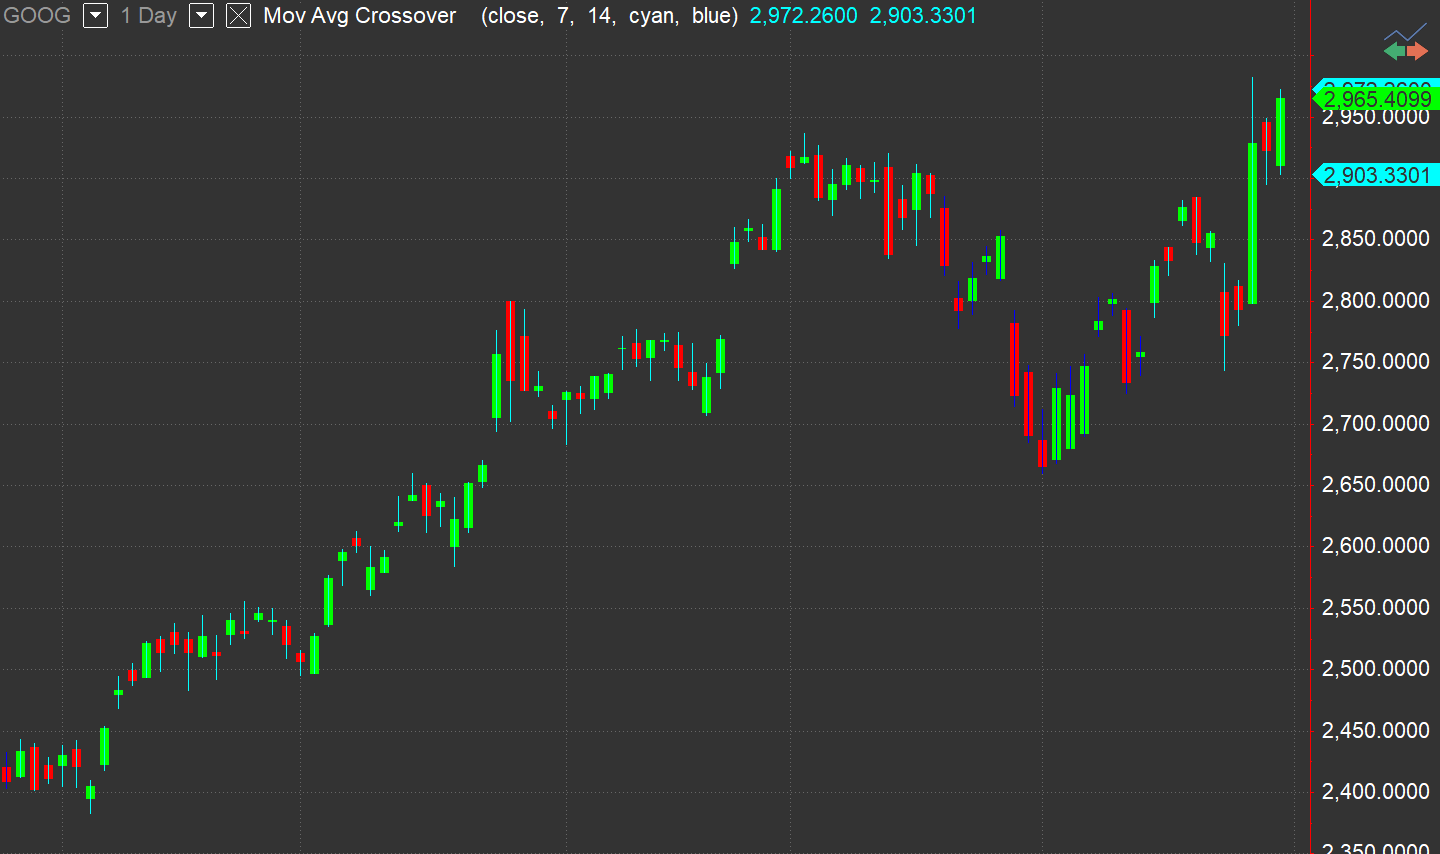
Mov Avg Crossover calculates fast and slow moving averages and paints the bars according to the relative position of the averages.
The bars during which the fast moving average is above the slow moving average are painted cyan. That indicates an uptrend, or a bullish period. The bars during which the slow moving average is above the fast moving average are painted blue. That may indicate a downtrend, or a bearish period.
Default Inputs
Price (Close) - price value used in calculation of the "fast" moving average.
FastLength (7) - number of bars included in calculation of the "fast" average.
SlowLength (14) - number of bars included in calculation of the "slow" average.
UpColor (Cyan) - bar color when the fast average is above the slow average.
DnColor (Blue) - bar color when the fast average is below the slow average.