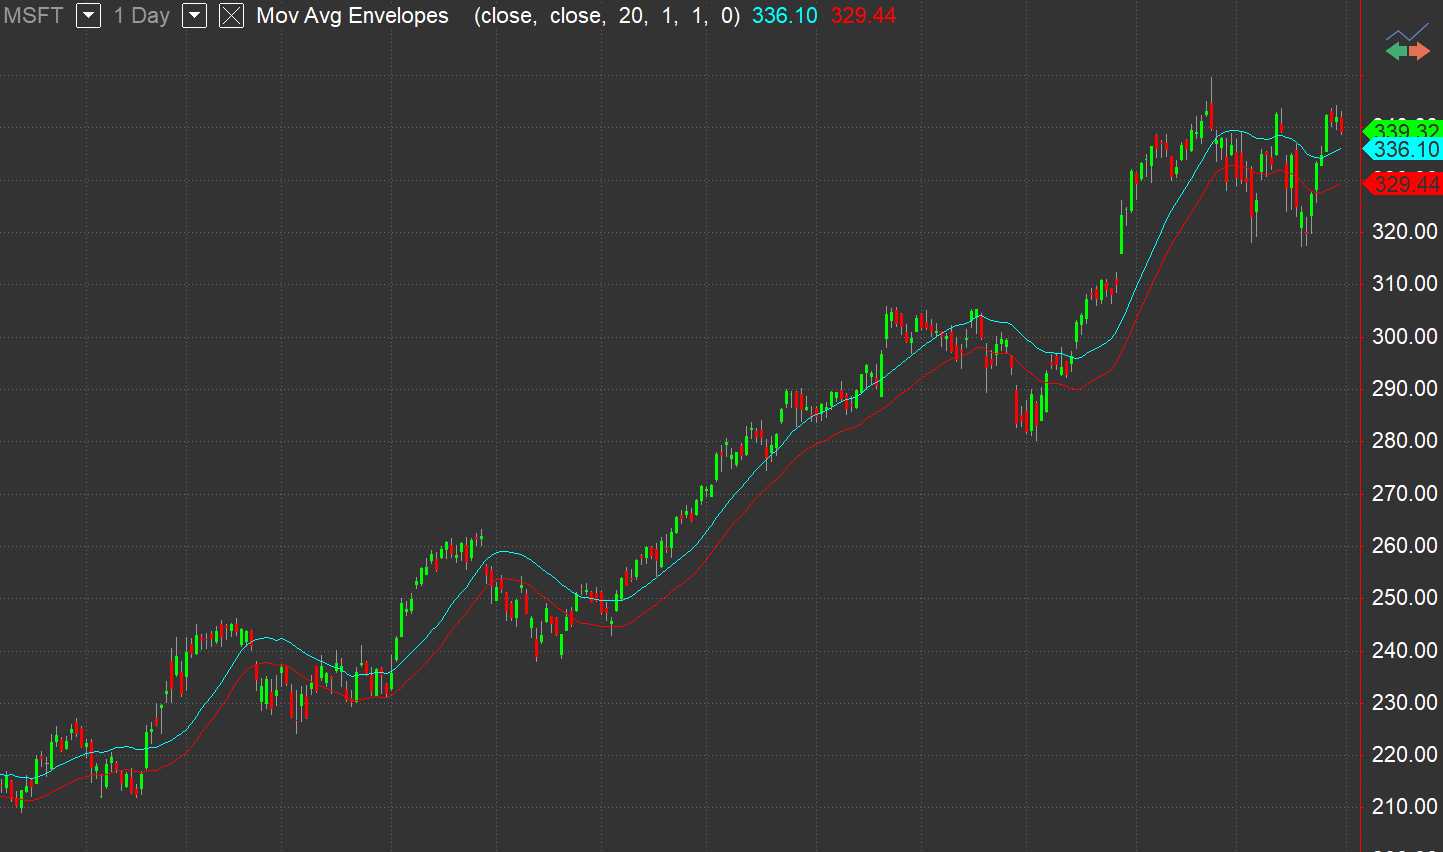
Mov Avg Envelopes
Moving Average Envelopes calculates 2 moving averages using PriceH and PriceL inputs. Both averages are calculated using price data from the same number of bars specified by Length input.
The average of the high price is increased by the percent value specified in PctAbove input and then plotted.
The average of the low price is reduced by the percent value specified in PctBelow input and then plotted. The moving averages themselves are not plotted by this indicator.
Moving averages are widely used for identifying trends. Moving averages of highs and lows adjusted for a fixed percentage may be helpful in finding overbought or oversold conditions and determining trading ranges.
Displaced Moving Average Envelopes plot the upper and lower envelopes values of a previous bar or later bar on the current bar. This indicator is not displaced by default. Changing the Displace input to a positive number displaces the plots to the left. Changing the Displace input to a negative number displaces the plots to the right
Default Inputs
PriceH (Close) - price value used in calculation of the upper envelope.
PriceL (Close) - price value used in calculation of the lower envelope.
Length (20) - number of bars included in calculation of the moving averages.
PctAbove (1) - percentage above the upper moving average to plot the upper envelope (for example, 1 = 1%).
PctBelow (1) - percentage below the lower moving average to plot the lower envelope (for example, 1 = 1%).
Displace (0) - number of bars to displace the plot of the moving average.
Plots
Plot1 (UpperBand, Cyan) - the upper envelope value.
Plot 2 (LowerBand, Red) - the lower envelope value.