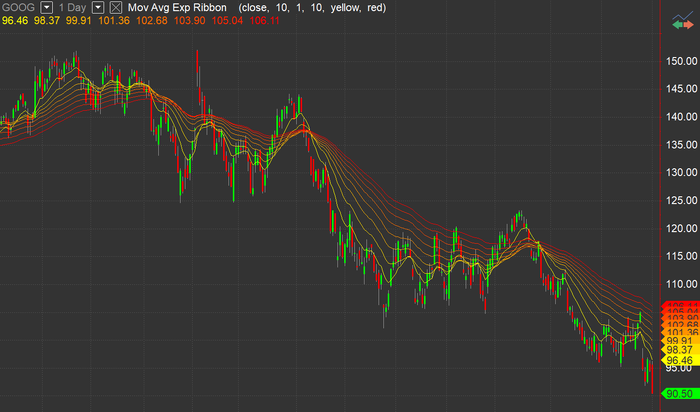
Mov Avg Exp Ribbon
Jump to navigation
Jump to search
Mov Avg Exp Ribbon plots a gradient moving average ribbon based on a series of exponential moving averages of different lengths.
The length of the first moving average is set in BaseLength input. Each of the subsequent moving averages length is calculated based on the ArithOrGeom_1or2 input.
Default Inputs
Price (Close) - price value used in calculation of the moving average.
BaseLength (10) - base moving average length.
ArithOrGeom_1or2 (1) - calculation type.
FastColor (Yellow) - fast value color.
SlowColor (Red) - slow value color.
