Difference between revisions of "Parabolic SAR"
Jump to navigation
Jump to search
m |
|||
| (One intermediate revision by the same user not shown) | |||
| Line 13: | Line 13: | ||
'''AfLimit (.2)''' - Limitation of acceleration factor. | '''AfLimit (.2)''' - Limitation of acceleration factor. | ||
| + | [[File:Parabolic-SAR-indicator.png|700px|link=https://www.multicharts.com/trading-software/images/4/48/Parabolic-SAR-indicator.png]] | ||
[[Category:Pre-built Indicators]] | [[Category:Pre-built Indicators]] | ||
Latest revision as of 14:46, 6 December 2022
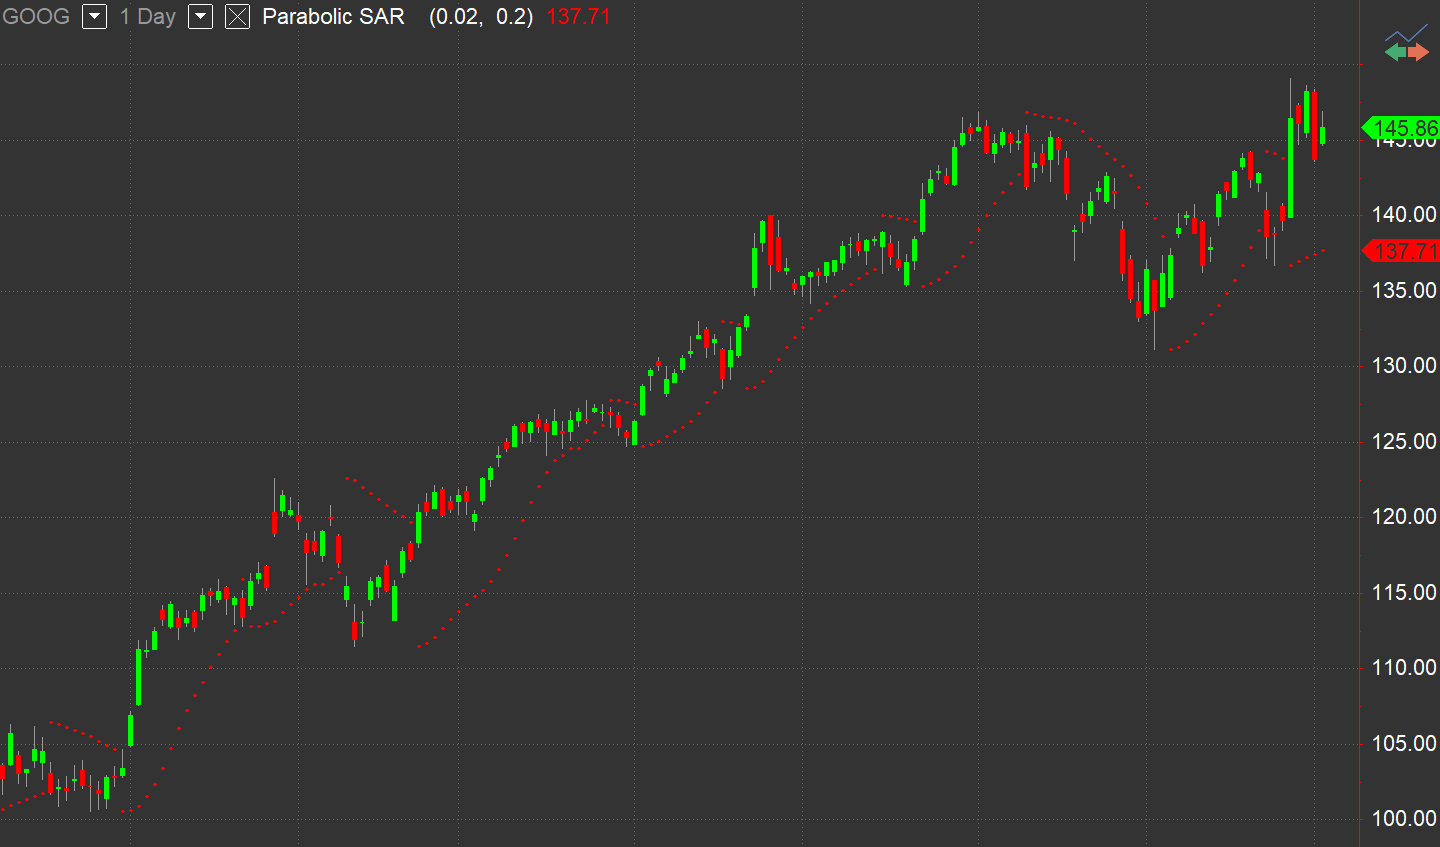
Parabolic SAR indicator, based on Welles Wilder's Parabolic Time/Price Strategy, plots a parabolic curve taking into consideration the market's price and time relations.
During the calculation, the parabolic curve crosses over and under the price. When the parabolic curve goes below the current prices the market is considered bullish, and when the curve crosses above the current prices, it may indicate a down trend.
The Parabolic SAR indicator determines stop and reverse (SAR) points and may be used to define when the position should be reversed and a trade in the opposite direction should be taken.
Default Inputs
AfStep (.02) - acceleration factor for calculation of the parabolic SAR.
AfLimit (.2) - Limitation of acceleration factor.